

Chart Mission 5 – Bulls vs Bears

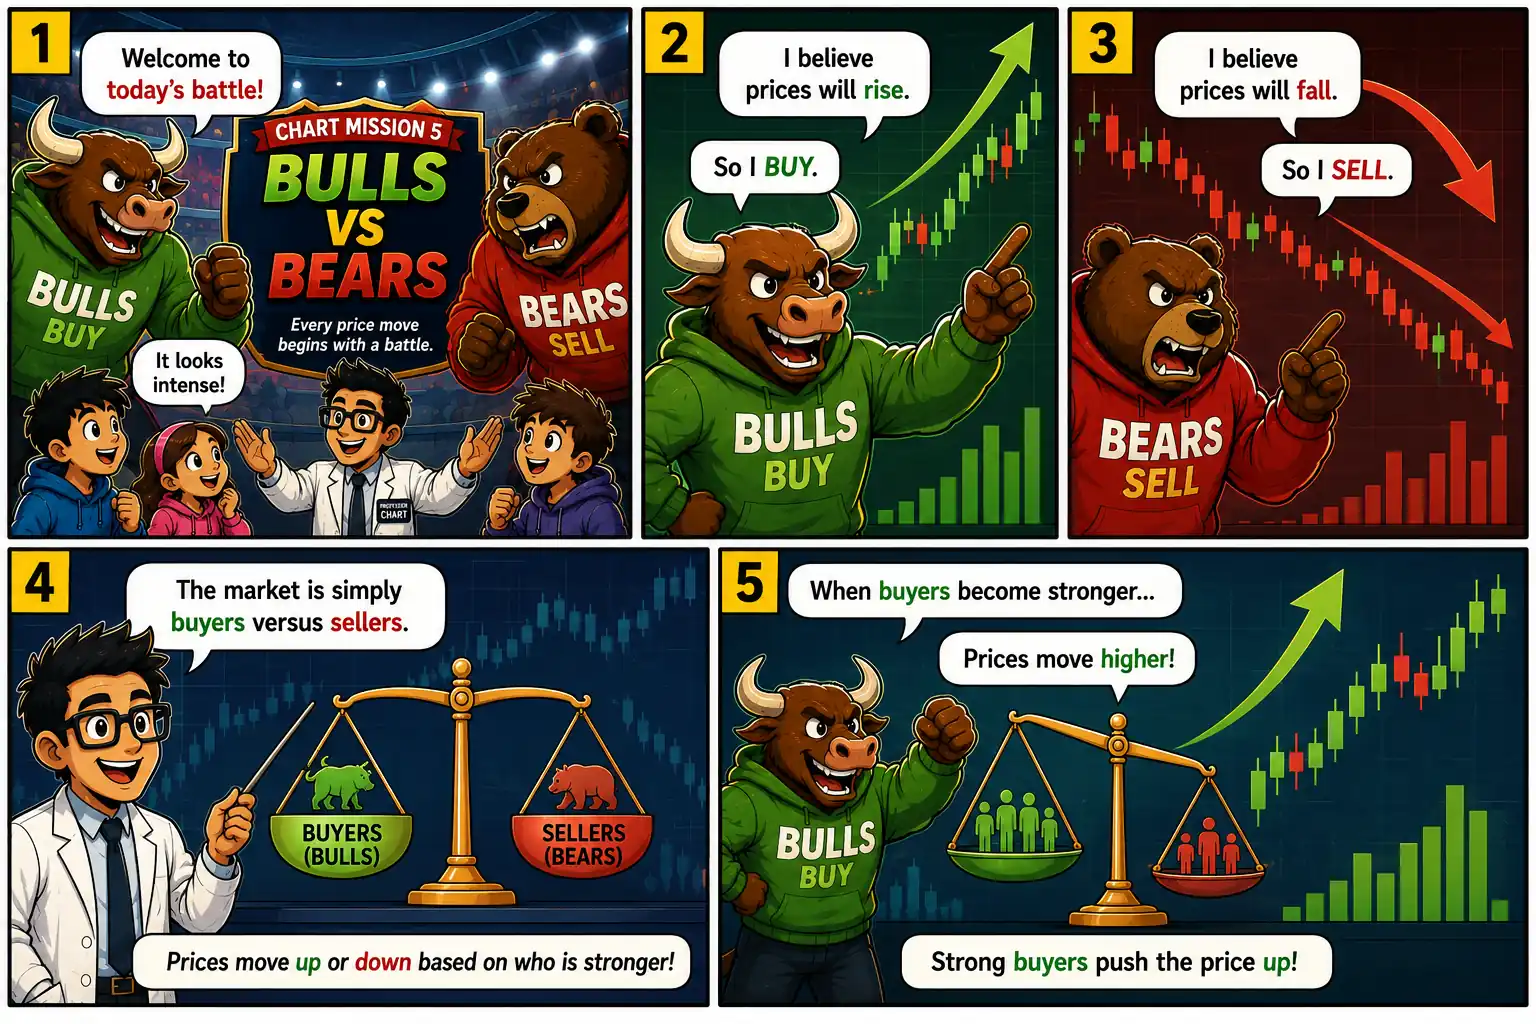
Chart Mission 5 Bulls vs Bears hero image showing Professor Chart explaining how buyers and sellers battle to move stock prices in the stock market.

Introduction

Arjun noticed that every financial news channel kept mentioning Bulls and Bears.

“The Bulls are winning.”

“The Bears have taken control.”

He looked confused.

“Professor, are there really animals inside the stock market?”

Professor Chart laughed.

“No.”

“They’re symbols.”

“The Bull represents buyers.”

“The Bear represents sellers.”

“And every price on every chart is simply the result of their battle.”

Today’s mission had begun.

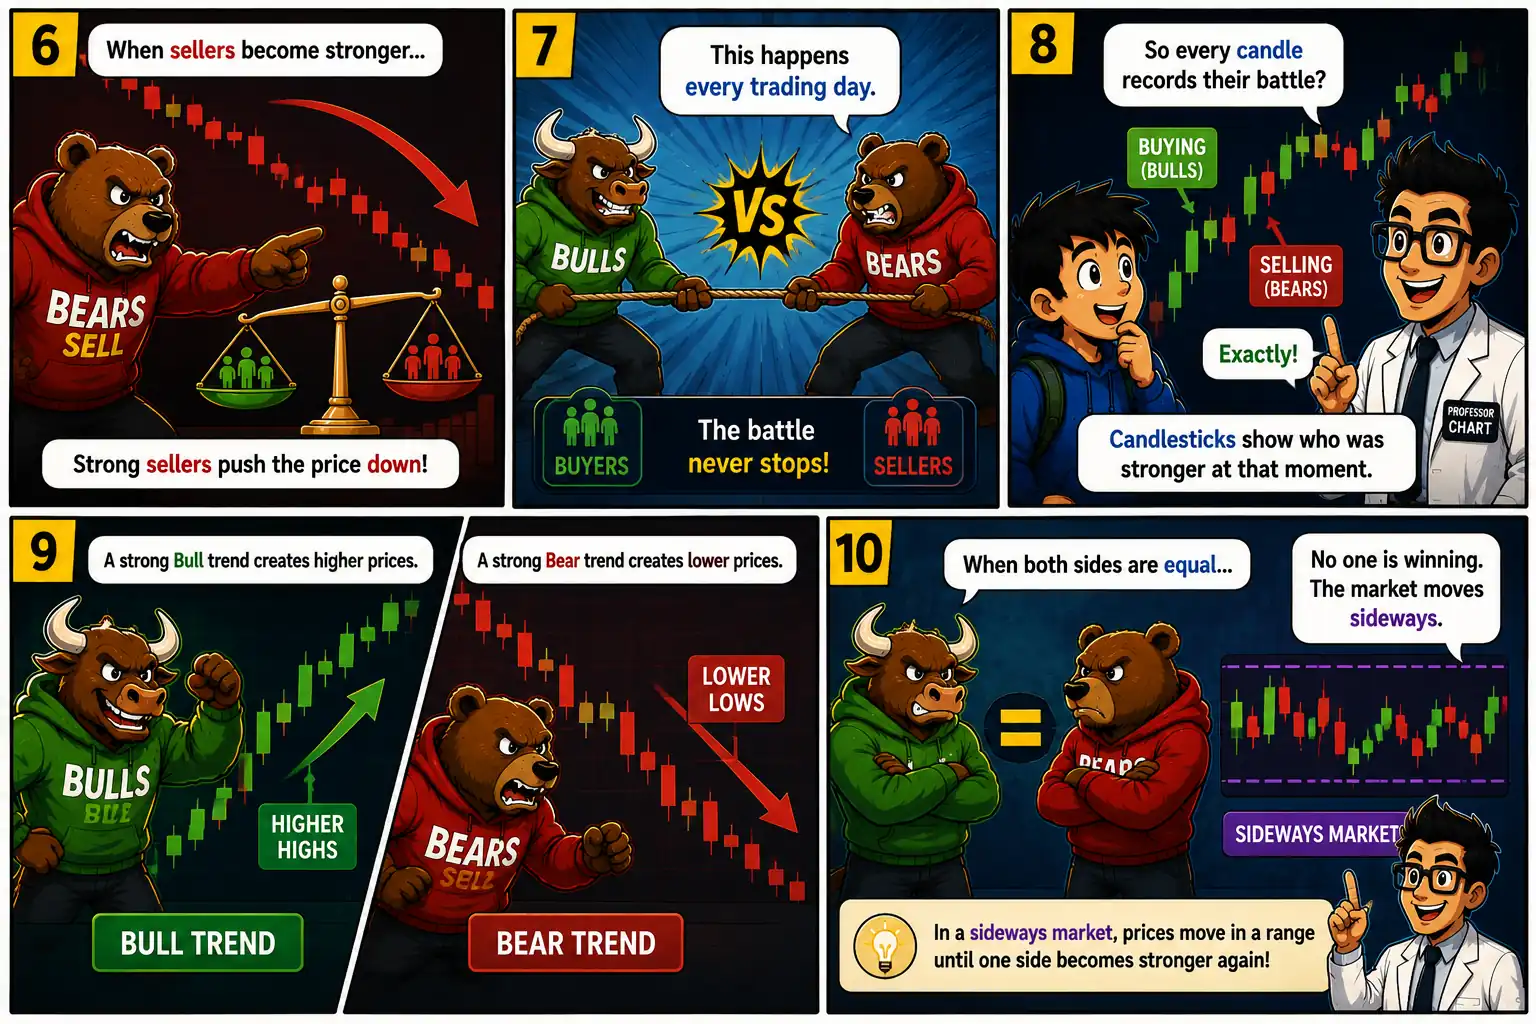
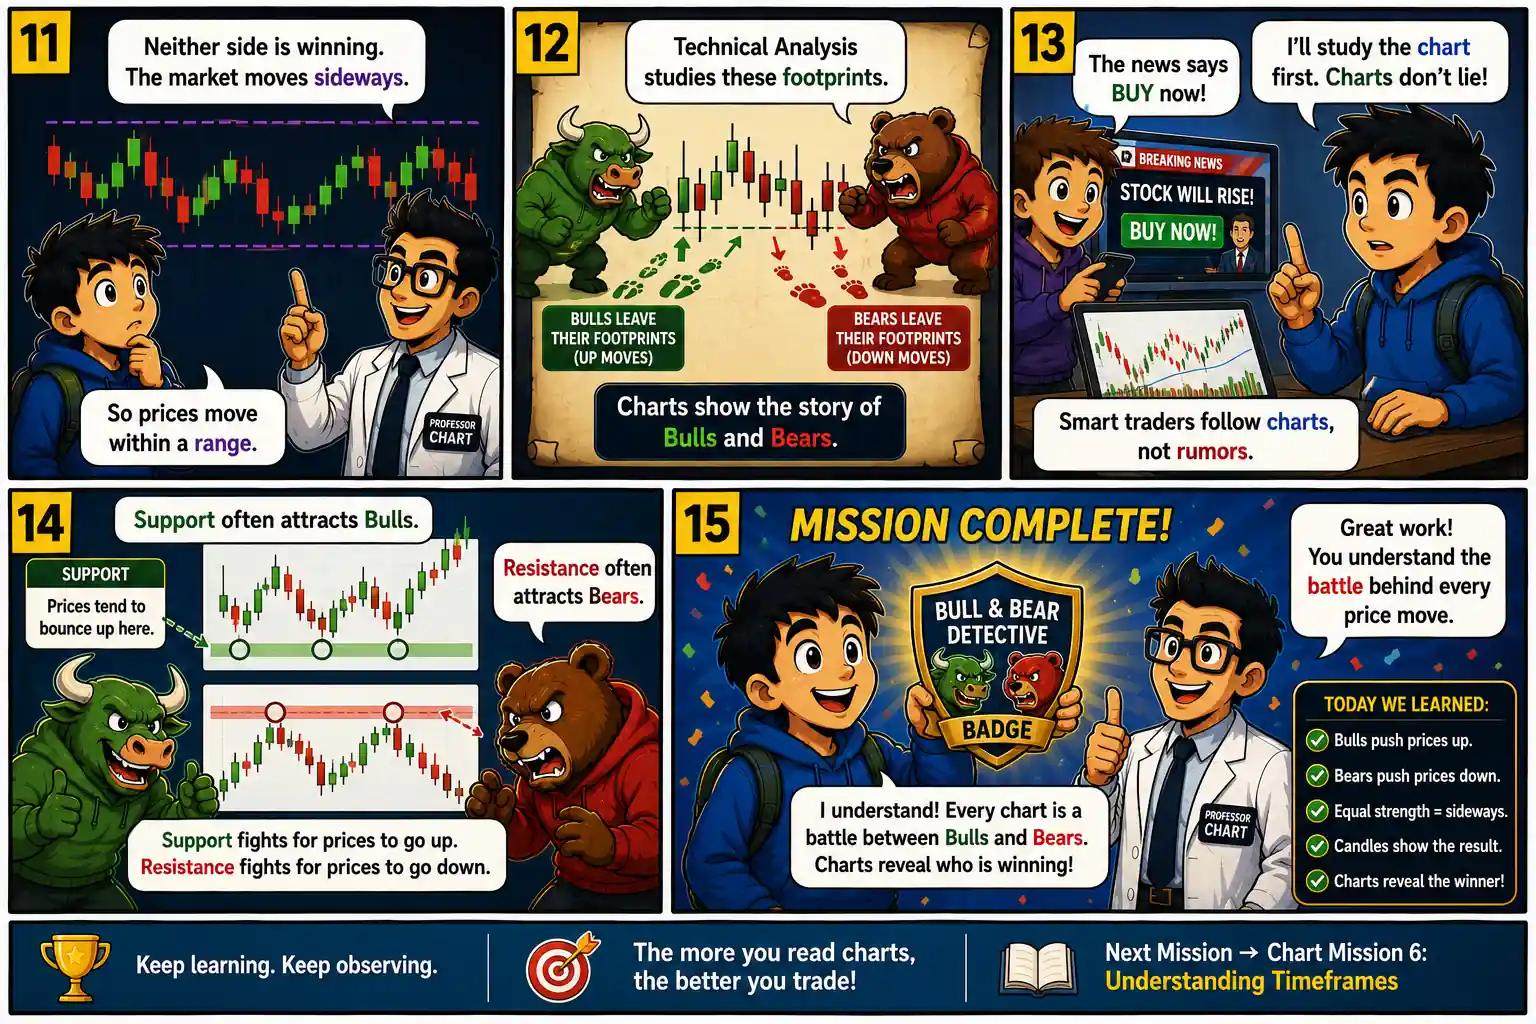
Chart Mission 5 comic panels 1 to 5 introducing the Bulls vs Bears battle, bullish buyers, bearish sellers, and how stronger buyers push stock prices higher. Chart Mission 5 comic panels 6 to 10 explaining bearish trends, daily buyer versus seller battles, candlestick charts, bull trends, bear trends, and sideways markets. Chart Mission 5 comic panels 11 to 15 showing chart analysis, market footprints, support and resistance, avoiding rumors, and earning the Bull & Bear Detective badge.

What We Learned

Every movement in the stock market is driven by the interaction between buyers and sellers.

  • Bullish market: Buyers are stronger than sellers, pushing prices upward.
  • Bearish market: Sellers are stronger than buyers, pushing prices downward.
  • Sideways market: Buyers and sellers are evenly matched, causing prices to move within a range.

Technical analysts focus on the outcome of this battle rather than emotions or rumors. Candlestick charts visually record the struggle between bulls and bears, allowing traders to identify trends, momentum, and potential turning points.

Understanding these market forces is one of the first steps toward reading charts with confidence.

Key Takeaways

  • 🟒 Bulls expect prices to rise.
  • πŸ”΄ Bears expect prices to fall.
  • πŸ“ˆ Strong buyers create uptrends.
  • πŸ“‰ Strong sellers create downtrends.
  • βš–οΈ Equal strength leads to sideways markets.
  • πŸ“Š Every candlestick reflects the battle between buyers and sellers.
  • 🧠 Technical analysts study price action to understand which side has the advantage.

Vocabulary

Bull – A market participant expecting prices to rise.

Bear – A market participant expecting prices to fall.

Bullish Trend – A sustained upward price movement.

Bearish Trend – A sustained downward price movement.

Sideways Market – A period where prices move within a range without a clear trend.

Smart Investor TipΒ 

Don’t cheer for the Bull or fear the Bear. Learn to recognize which side is in control before making a trading decision.

Next Chart Mission Preview

Chart Mission 6 – Understanding Timeframes

Can the same stock be bullish, bearish, and sidewaysβ€”all at the same time? It may sound impossible, but it depends on the chart you’re looking at. In the next mission, Professor Chart introduces Arjun to the fascinating world of multiple timeframes, where a 5-minute chart, a daily chart, and a weekly chart can each tell a completely different story. Learn why professional traders always check more than one timeframe before making a decision, and discover how choosing the right chart can help you avoid costly mistakes and identify stronger trading opportunities.

Coming Next: Chart Mission 6 – Understanding Timeframes

Scroll to Top