
Chart Mission 11 – Doji: The Indecision Candle

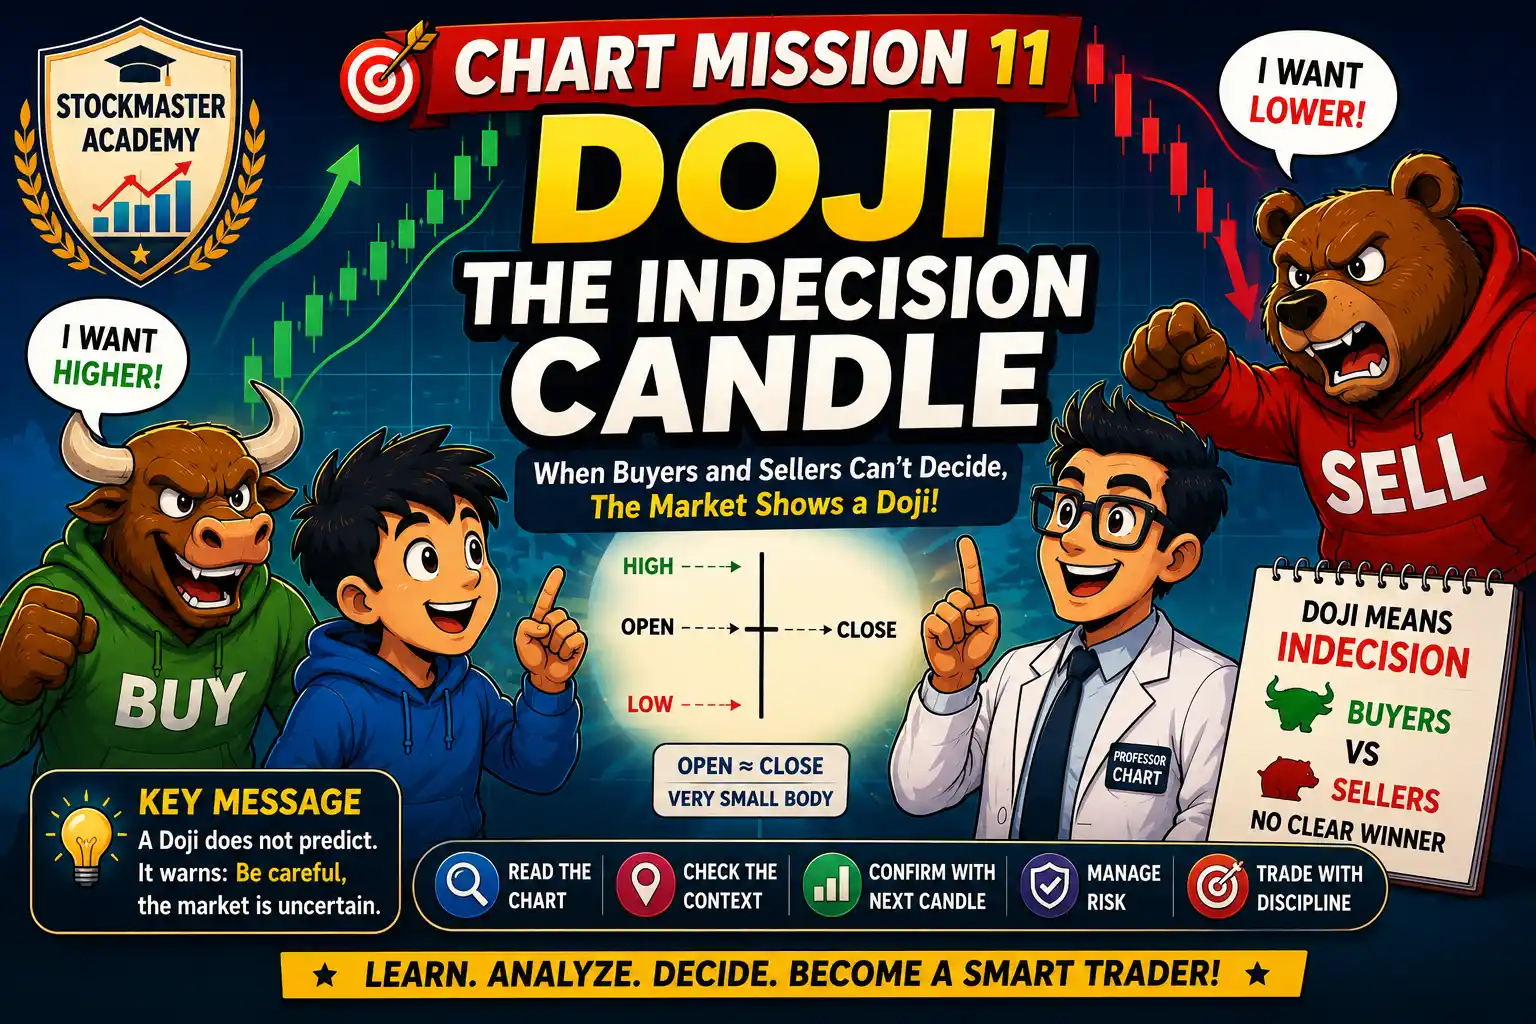
Chart Mission 11 Doji the indecision candle explaining how buyers and sellers create a Doji candlestick

Introduction

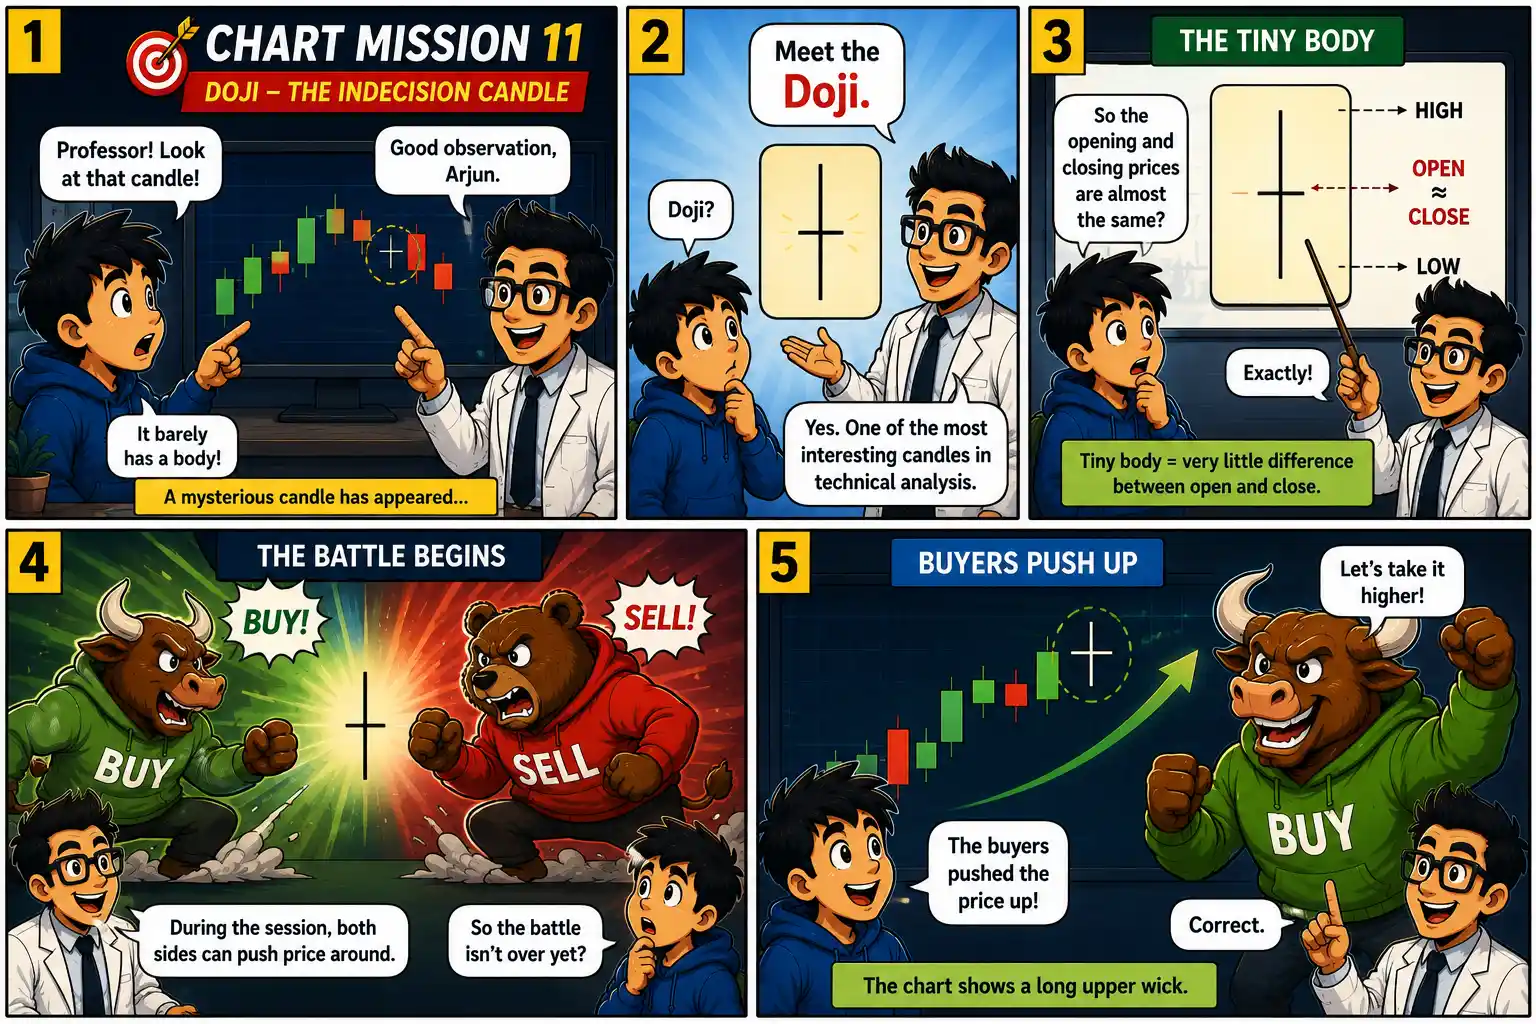
Arjun was becoming more comfortable reading stock charts.

He could now recognise bullish and bearish candles. He understood that every candle represented a battle between buyers and sellers.

But one day, he noticed something strange.

The candle had almost no body.

Arjun looked at Professor Chart.

Arjun: “Professor, what happened to this candle?”

Professor Chart smiled.

Professor Chart: “Nothing happened? Oh, something very important happened.”

He pointed at the tiny candle.

Professor Chart: “The buyers and sellers fought hard—but neither side won.”

Welcome to the world of the Doji.

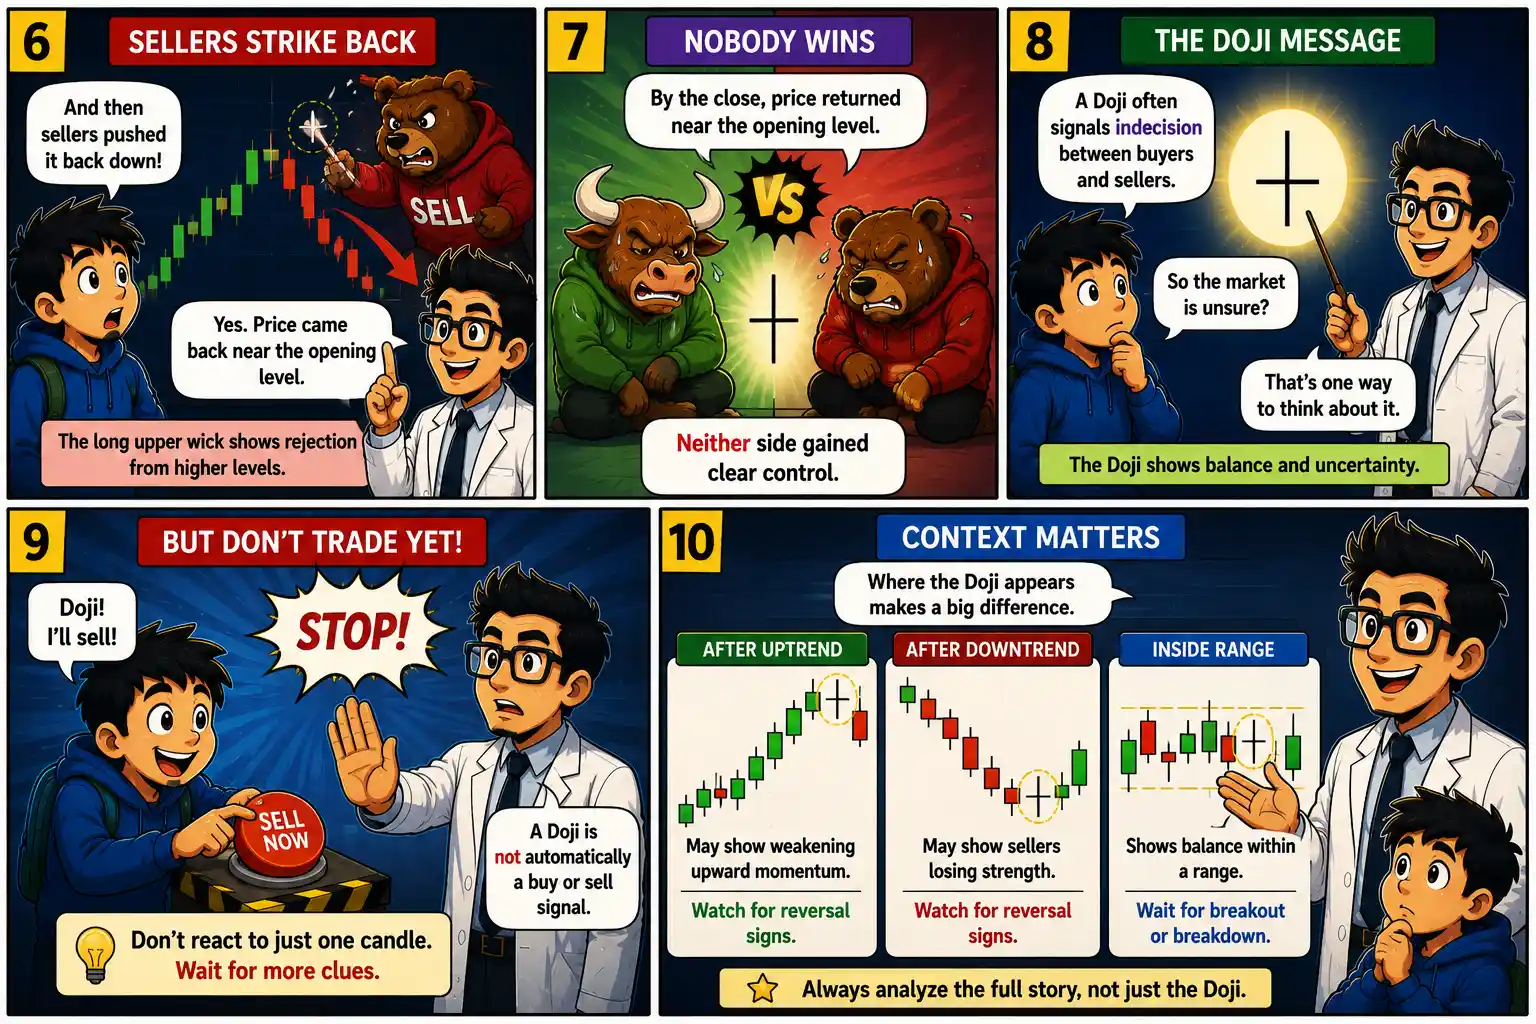
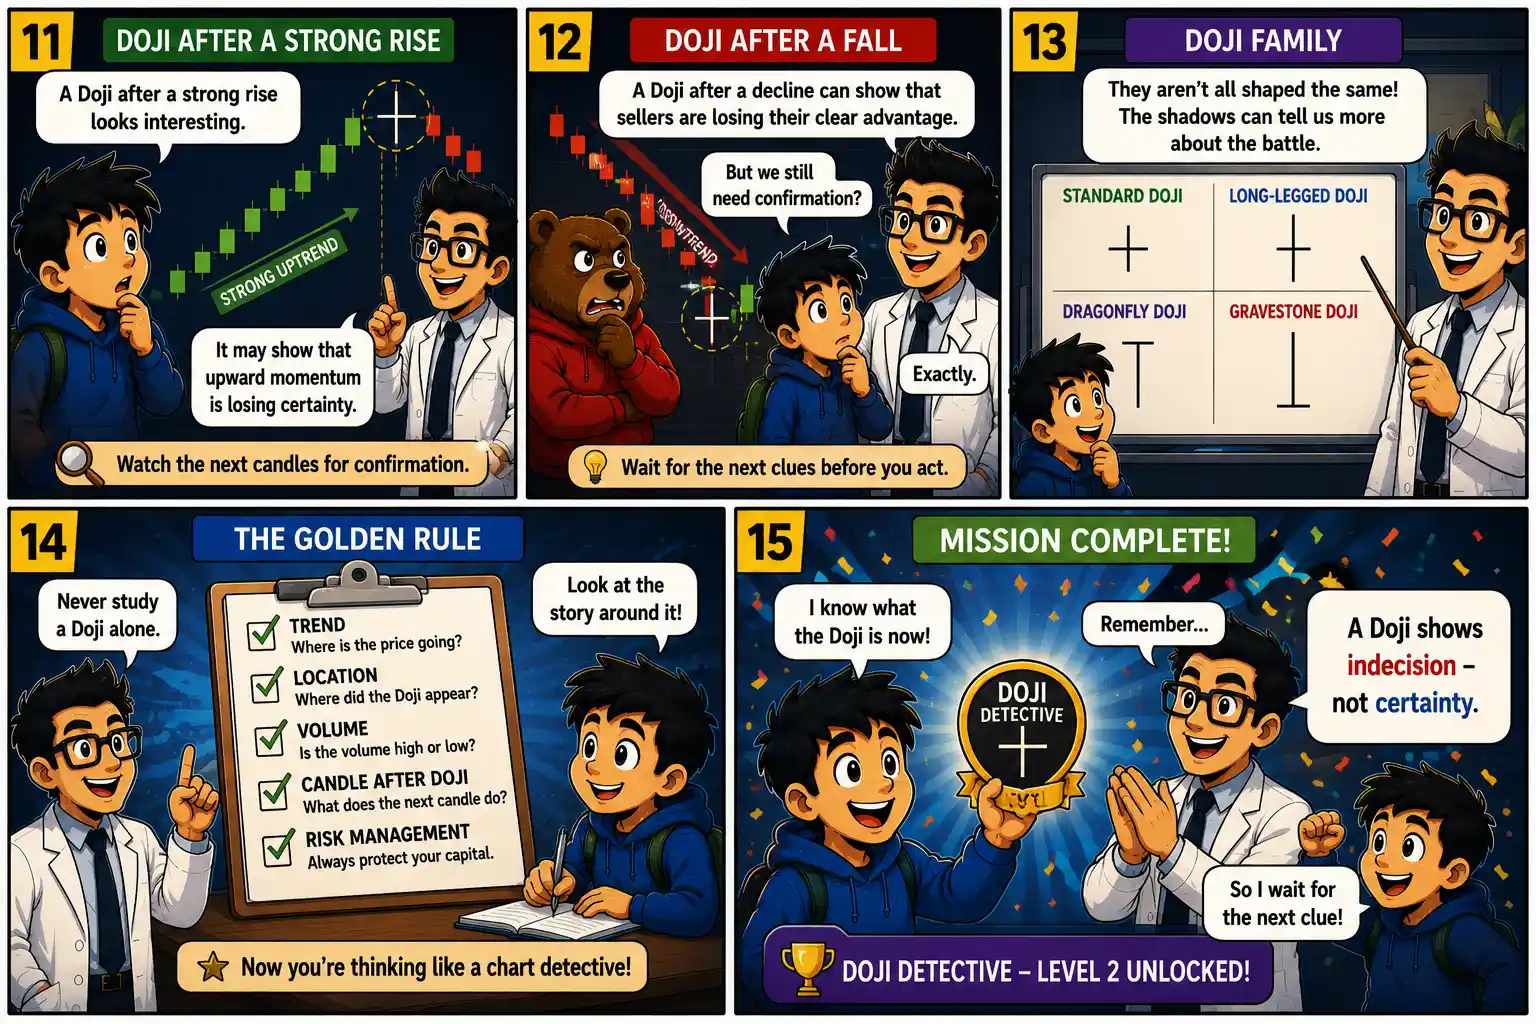
Chart Mission 11 panels 1 to 5 introducing the Doji candlestick and explaining its tiny body and open and close prices Chart Mission 11 panels 6 to 10 showing sellers striking back, market indecision, and why Doji context matters Chart Mission 11 panels 11 to 15 explaining Doji after a rise or fall, Doji types, confirmation, and the Doji Detective achievement

What We Learned

A Doji is a candlestick in which the opening and closing prices are very close.

It represents a session where the battle between buyers and sellers ends without a clear winner.

However, a Doji should not be treated as an automatic reversal signal.

Its importance depends on its context.

For example, a Doji appearing after a powerful uptrend may suggest that buying momentum is becoming less decisive. A Doji after a prolonged decline may indicate that selling pressure is no longer as dominant.

But traders should look for confirmation from subsequent price action, along with trend, support/resistance, volume and risk management.

Key Takeaways

  • A Doji has a very small or almost nonexistent real body.
  • The open and close are usually very close.
  • It represents market indecision.
  • Buyers and sellers may both have pushed price significantly during the session.
  • A Doji does not automatically mean reversal.
  • Context is extremely important.
  • The next candle can provide valuable confirmation.
  • Support, resistance, trend and volume can strengthen the analysis.
  • Always combine candle analysis with proper risk management.

Vocabulary

Doji
A candlestick where the opening and closing prices are very close.

Real Body
The area between the opening and closing prices.

Upper Shadow
The line extending above the real body.

Lower Shadow
The line extending below the real body.

Indecision
A situation where neither buyers nor sellers have clear control.

Confirmation
Additional price action that helps support or challenge a trading interpretation.

Smart Investor Tip 

A Doji is a question mark—not an answer.

Don’t immediately trade because you see one.

Ask:

Where did it appear? What happened before it? What happens next?

Next Chart Mission Preview

Chart Mission 12 – Hammer Saves the Bulls

The market has been falling, but suddenly a powerful candle appears with a long lower shadow. Buyers have stepped in and pushed the price back up from the lows. Join Arjun and Professor Chart as they investigate the Hammer candlestick, discover why it can signal a possible shift in momentum, and learn why traders should always wait for confirmation before making a decision.

Coming Next: Chart Mission 12 – Hammer Saves the Bulls

Scroll to Top