Chart Mission 2 – Price Tells a Story

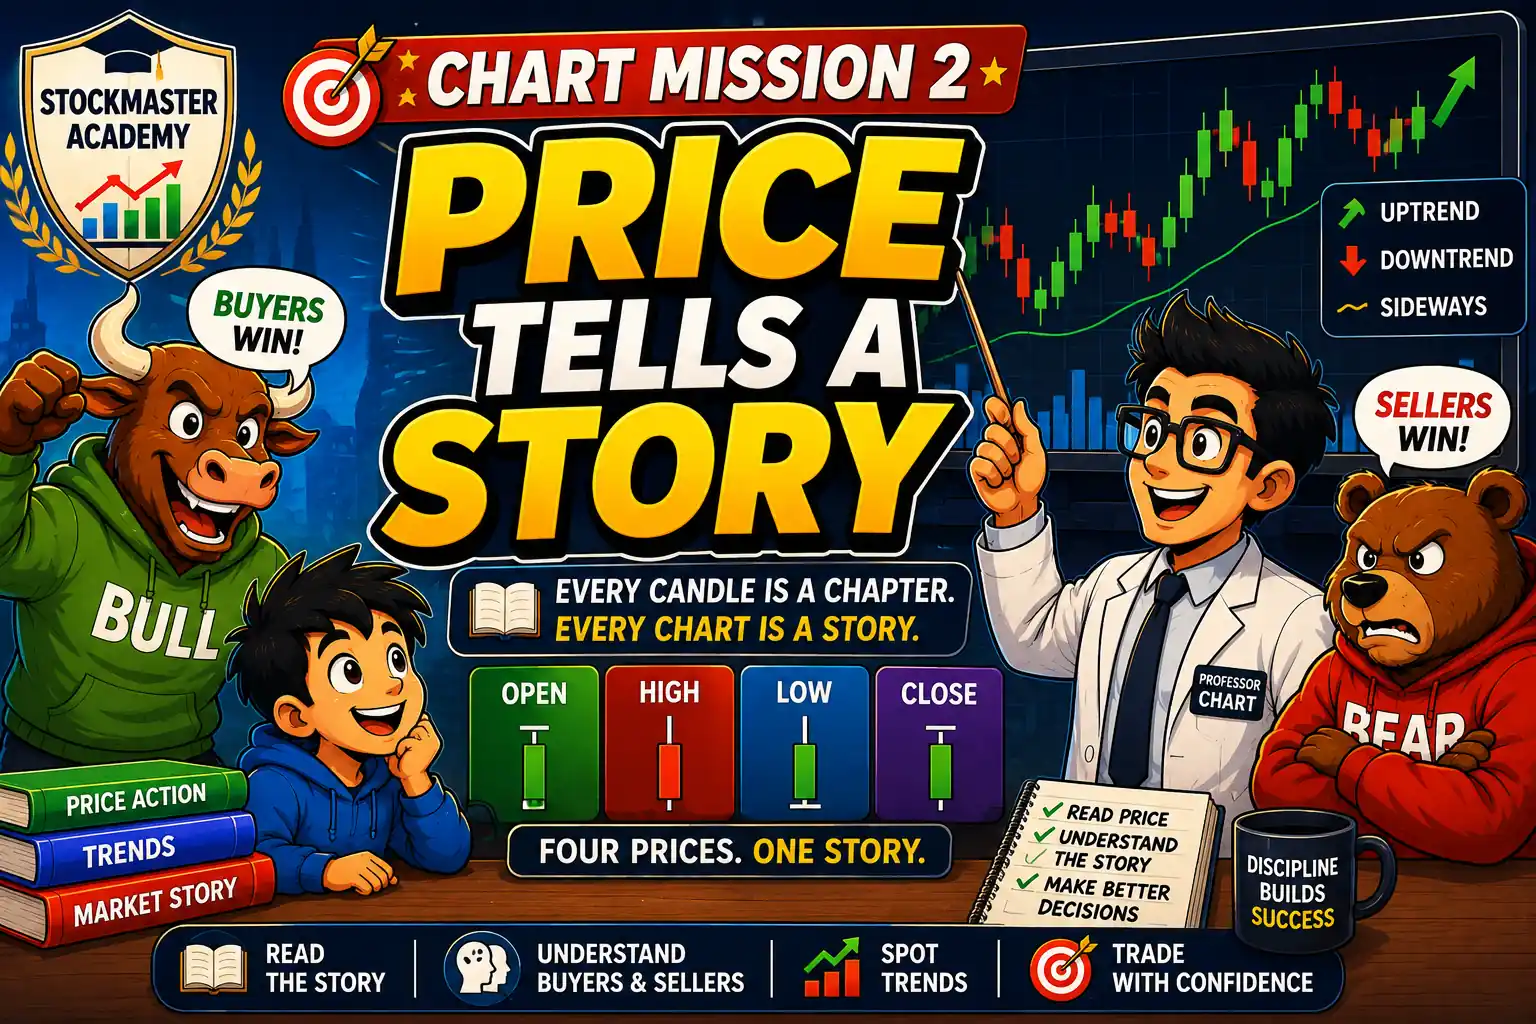
Chart Mission 2 – Price Tells a Story hero image featuring Professor Chart explaining how price action and candlesticks reveal the story of buyers and sellers in the stock market.

Introduction

Arjun walked into Chart Academy feeling more confident than ever. After completing his first mission, he had learned that technical analysis was about studying price, volume, and trends instead of trying to predict the future. But one question still bothered him.

He looked at the giant trading screen in front of him and asked Professor Chart, “If charts are just collections of candles, how do traders know what those candles are trying to say?”

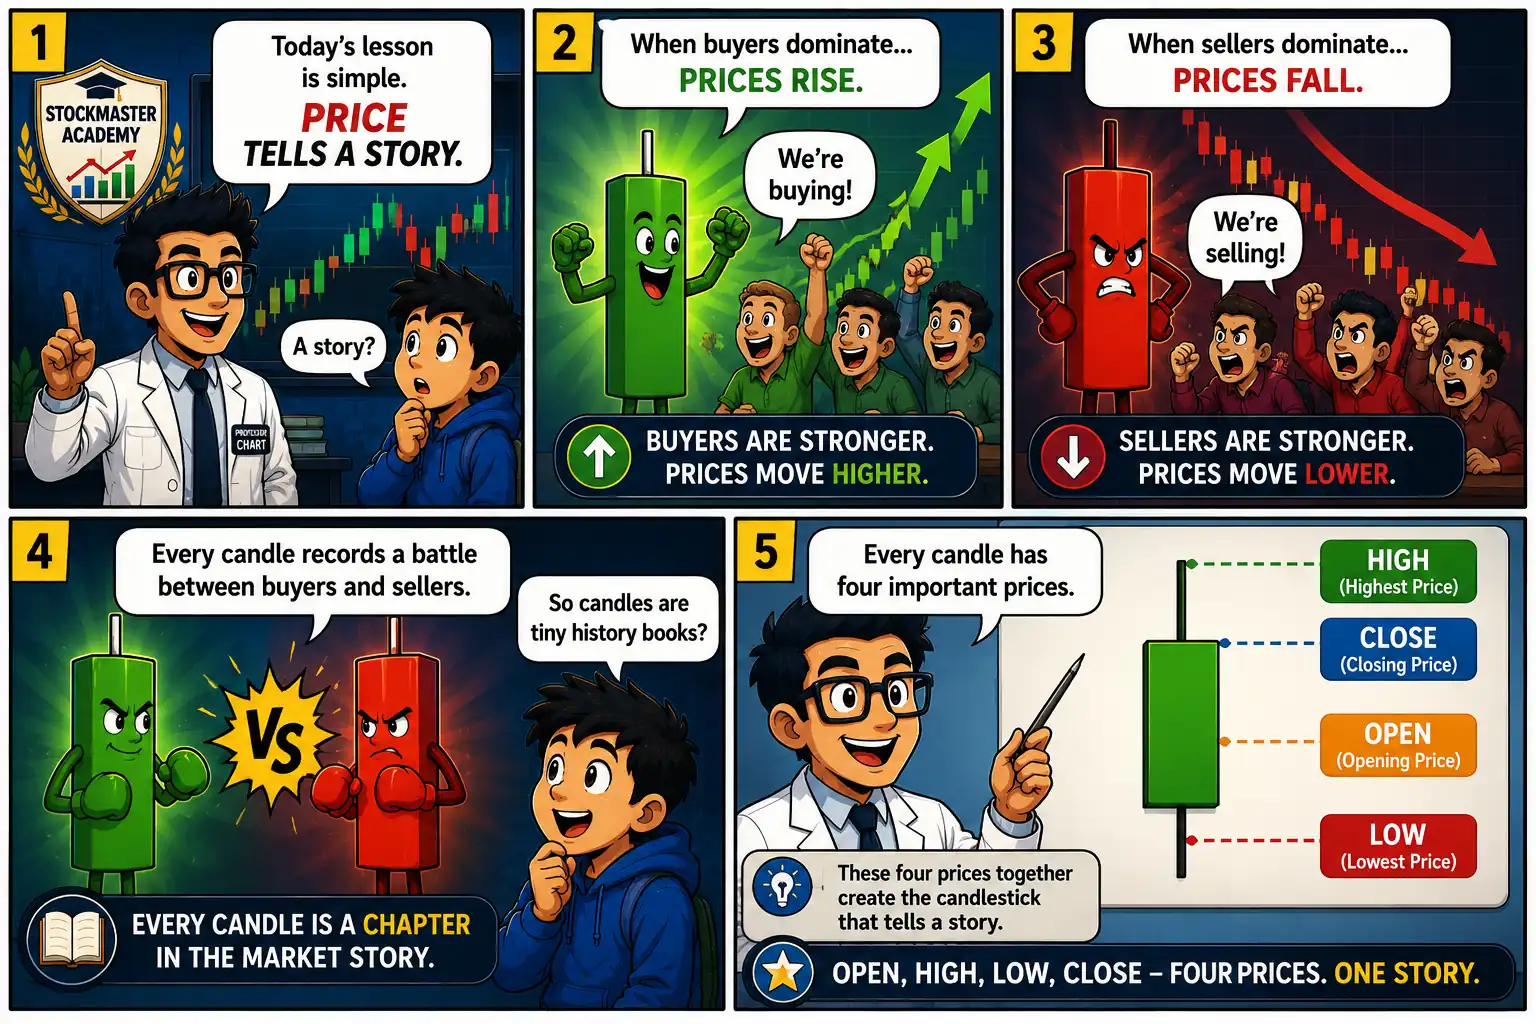
Professor Chart smiled and pointed toward a glowing candlestick chart. Instantly, the candles came to life. A bright green candle transformed into a group of excited buyers cheering as they competed to purchase shares. Moments later, a large red candle appeared, showing worried sellers rushing to exit their positions. Each candle became a tiny scene from the market, revealing the emotions and decisions of thousands of traders.

“Look carefully,” Professor Chart said. “Every price movement tells a story. When buyers become stronger than sellers, prices usually move higher. When sellers gain control, prices often move lower. Every candle records this battle and preserves it for us to study.”

Arjun watched in amazement as the candles connected together like chapters in a book. A single candle showed only one moment, but dozens of candles together revealed how the story had unfolded over time. Some stories showed confidence, others showed fear, while many reflected uncertainty and changing emotions.

Professor Chart continued, “Most beginners spend their time listening to rumors, television debates, or social media opinions. Professional traders start somewhere else—they start with price. Price reflects the combined actions of millions of market participants and often tells the truth long before headlines catch up.”

Arjun picked up his notebook and wrote his first lesson of the day:

“Every chart is a story, and every candle is a chapter. If I can learn to read the story, I can better understand the market.”

Mission Two had officially begun.

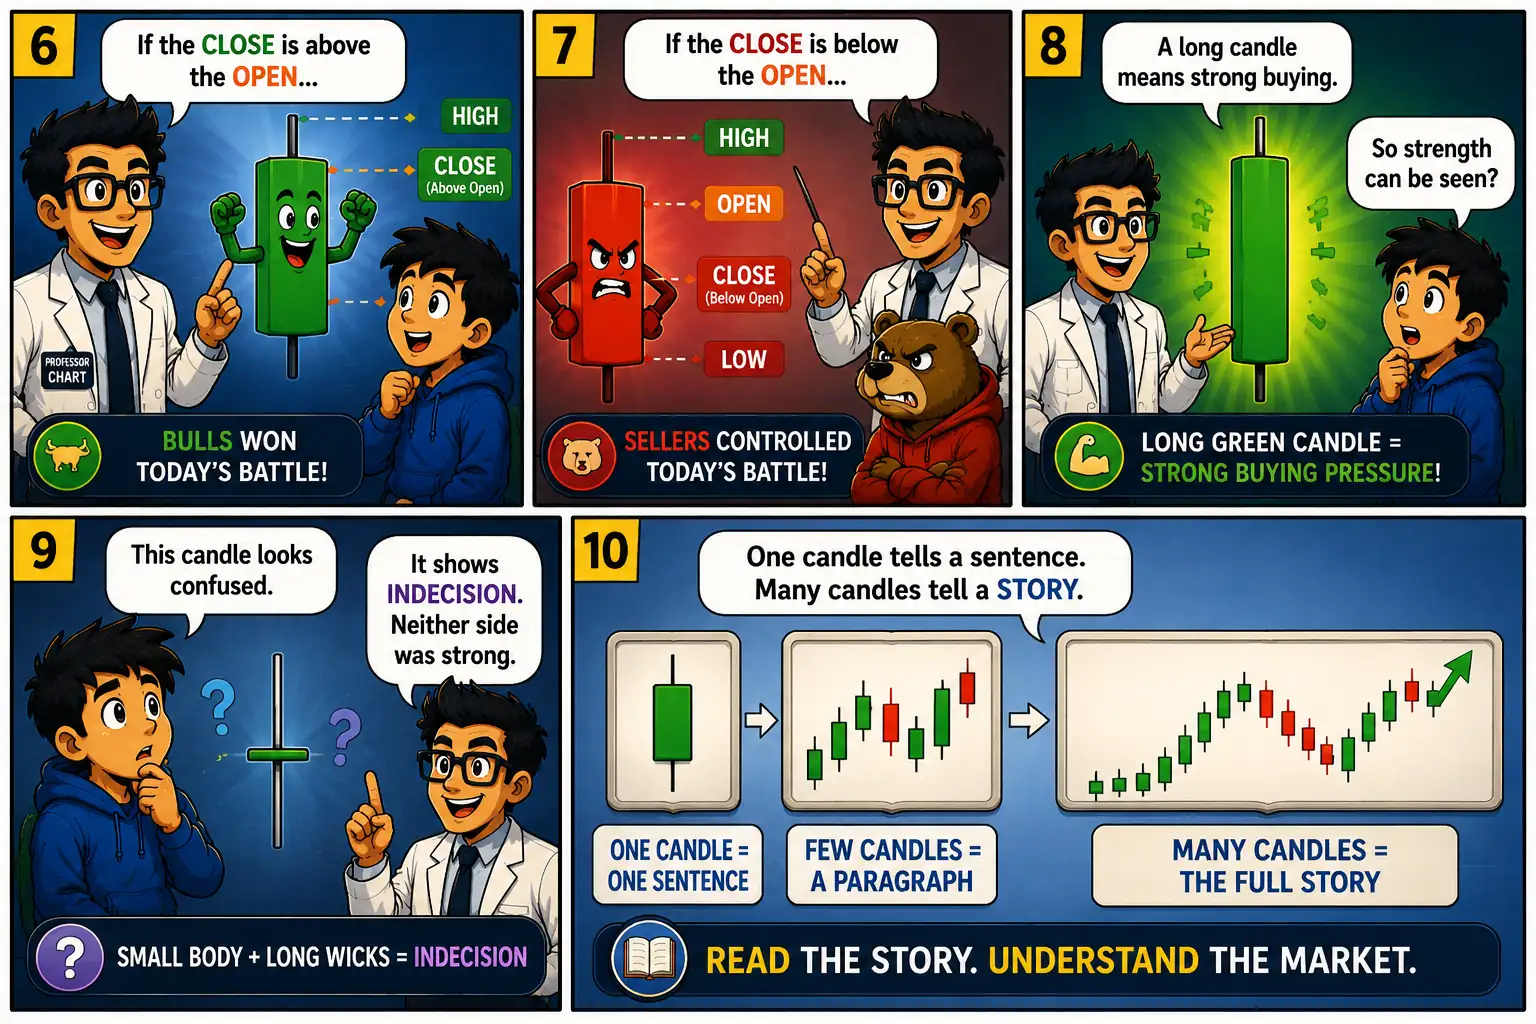
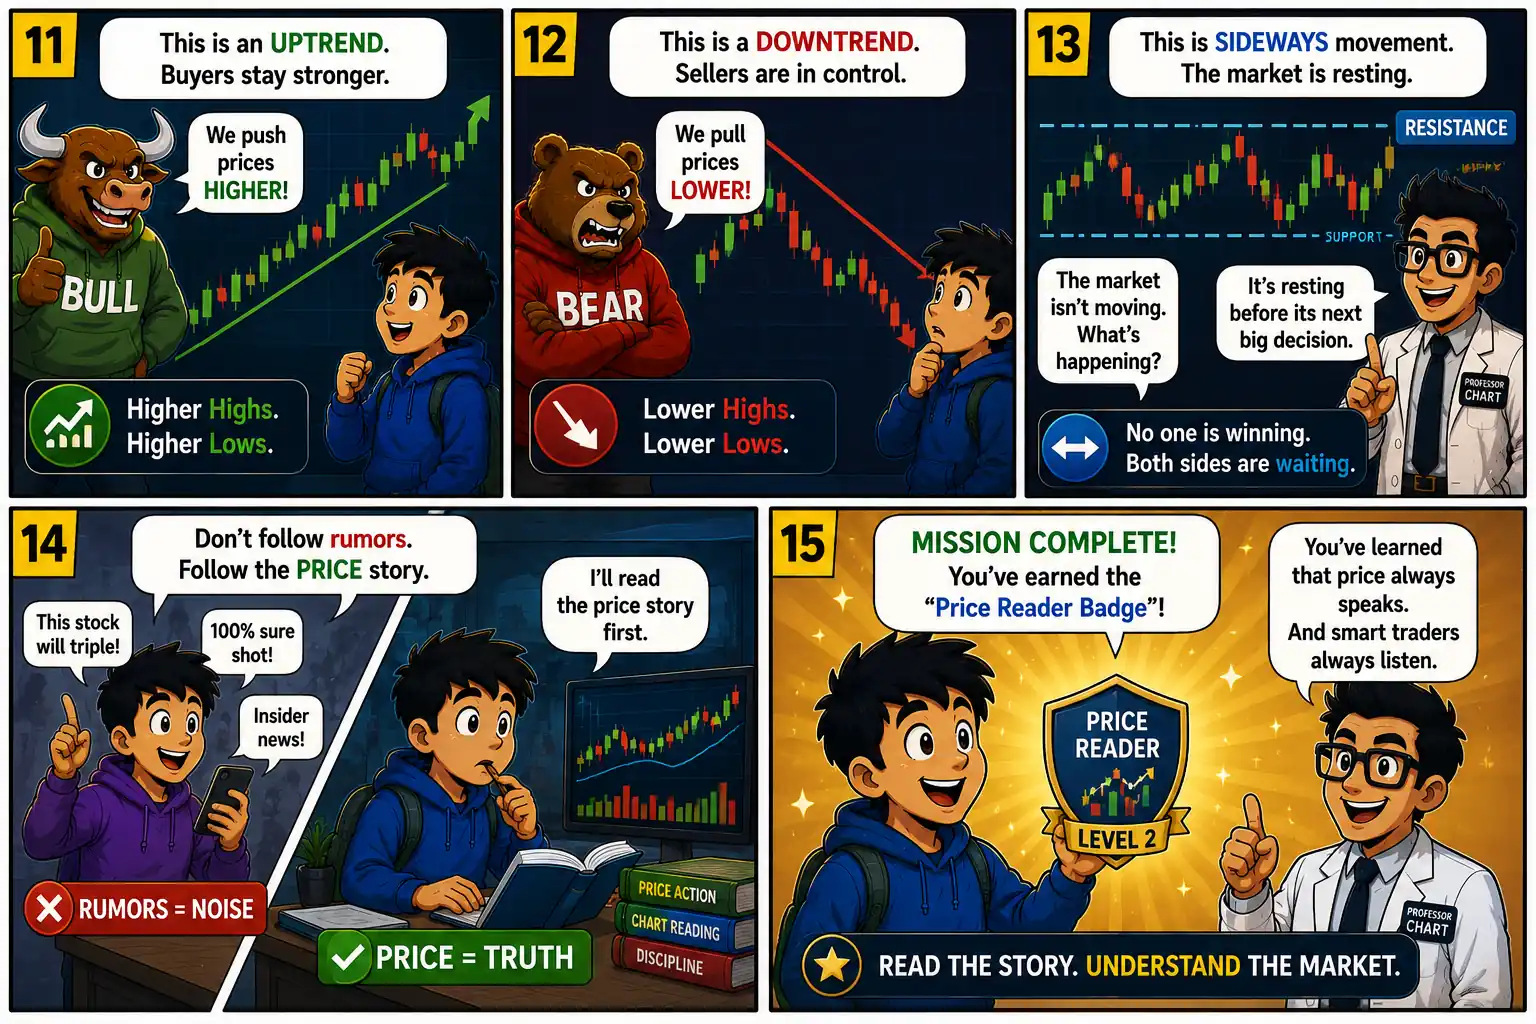
Chart Mission 2 comic panels 1 to 5 introducing how price tells a story, buyers versus sellers, candlestick battles, and the four candlestick prices: open, high, low, and close. Chart Mission 2 comic panels 6 to 10 explaining bullish and bearish candlesticks, buying pressure, indecision candles, and how multiple candlesticks reveal the market story. Chart Mission 2 comic panels 11 to 15 demonstrating uptrends, downtrends, sideways markets, avoiding rumors, reading price action, and earning the Price Reader Level 2 badge.

What We Learned

The most important lesson from this mission is that price is the foundation of technical analysis. Everything that happens in the stock market—company earnings, economic news, interest rate changes, investor expectations, and market sentiment—is ultimately reflected in the price of a stock. This is why technical analysts always begin by studying price before looking at any indicators or opinions.

A candlestick is much more than a colorful shape on a chart. It records four important pieces of information: the Open, High, Low, and Close prices during a specific period. Together, these values tell us how buyers and sellers interacted throughout that session. If buyers gained control and pushed prices higher, the candle usually closes above its opening price. If sellers dominated, the candle typically closes lower. By studying these candles, traders can understand which side had greater strength.

However, one candlestick tells only a small part of the story. Just as a single page cannot explain an entire novel, one candle cannot explain the complete market picture. When multiple candles are viewed together, they begin to reveal patterns, trends, momentum, and changes in market behavior. A series of higher highs and higher lows often signals an uptrend, while lower highs and lower lows may indicate a downtrend. Sideways movement can suggest that buyers and sellers are evenly matched, waiting for fresh information before making their next move.

This mission also highlights an important habit shared by successful traders: they trust price more than rumors. News headlines, television discussions, and social media posts can influence emotions, but price reflects the actual decisions made by millions of participants buying and selling in real time. Rather than asking, “What are people saying?” experienced traders ask, “What is the price telling me?”

Understanding price does not guarantee perfect predictions. Markets are influenced by many factors and can always surprise participants. Instead, reading price helps traders make more informed decisions by understanding probabilities rather than certainties. It encourages discipline, patience, and objective thinking instead of emotional reactions.

As you continue through the Chart Mission series, remember one simple rule:

The market may speak many languages, but price is its clearest voice. Learn to read it carefully, and every chart will begin to tell a meaningful story.

Key Takeaways

  • 📈 Price is the foundation of technical analysis.
  • 🕯️ Every candlestick tells a story about buyers and sellers.
  • 📊 Every candle has four prices: Open, High, Low, and Close.
  • 🟢 Green candles often show buying strength.
  • 🔴 Red candles often show selling pressure.
  • 📖 Many candles together reveal the market’s story.

Vocabulary

Price – The value at which a stock is traded.

Open – The first traded price of the session.

High – The highest traded price.

Low – The lowest traded price.

Close – The last traded price.

Trend – The overall direction of price movement.

Candlestick – A visual representation of price movement over a specific time period.

Smart Investor Tip 

Never ask what people are saying about a stock before asking what the price is saying.

Next Chart Mission Preview

Chart Mission 3 – Candlestick vs Line Chart

Arjun has discovered that every price tells a story, but a new mystery awaits inside Chart Academy.

As he explores the trading hall, he notices two giant screens displaying the very same stock. One screen shows a simple line chart, while the other is filled with colorful green and red candlesticks.

Confused, Arjun asks,

“Both charts show the same price… so why do professional traders use candlestick charts instead of line charts?”

Professor Chart smiles and replies,

“A line chart shows only the destination. A candlestick chart reveals the entire journey.”

Watch as Professor Chart explains the difference between line charts and candlestick charts, what each chart reveals, and why candlesticks provide valuable clues about buyer and seller behavior, market emotions, and price action.

Coming Next: Chart Mission 3 – Candlestick vs Line Chart

Scroll to Top