

Next Chart Mission Preview
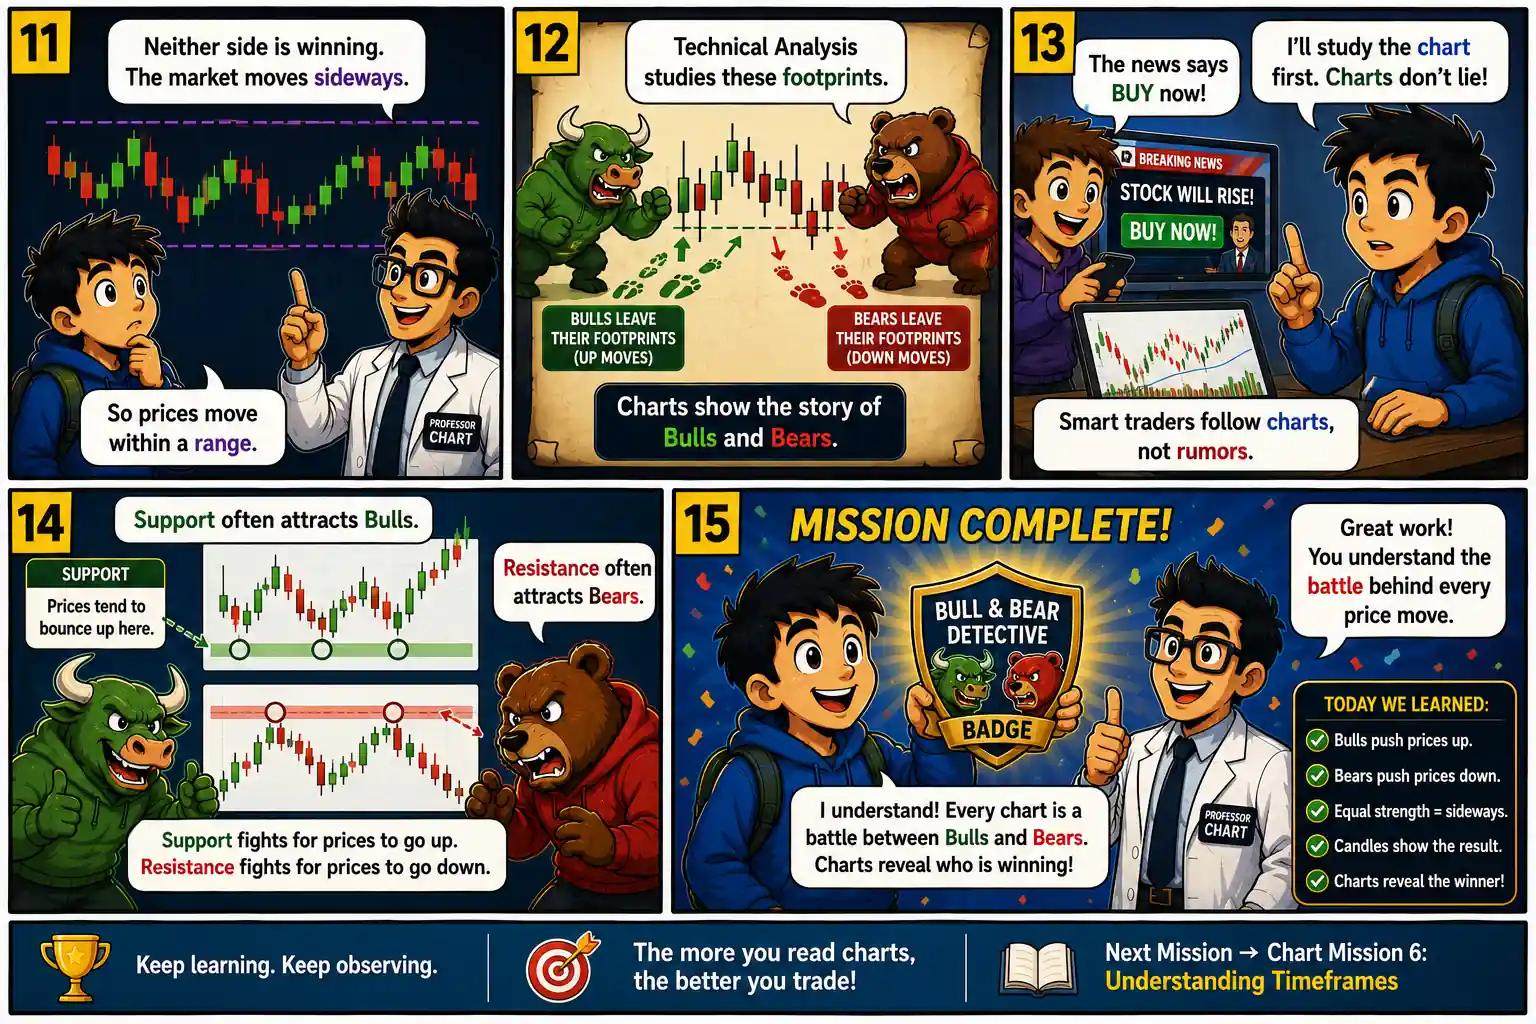
Chart Mission 6 – Understanding Timeframes
Can the same stock be bullish, bearish, and sideways—all at the same time? It may sound impossible, but it depends on the chart you’re looking at. In the next mission, Professor Chart introduces Arjun to the fascinating world of multiple timeframes, where a 5-minute chart, a daily chart, and a weekly chart can each tell a completely different story. Learn why professional traders always check more than one timeframe before making a decision, and discover how choosing the right chart can help you avoid costly mistakes and identify stronger trading opportunities.
Coming Next: Chart Mission 6 – Understanding Timeframes