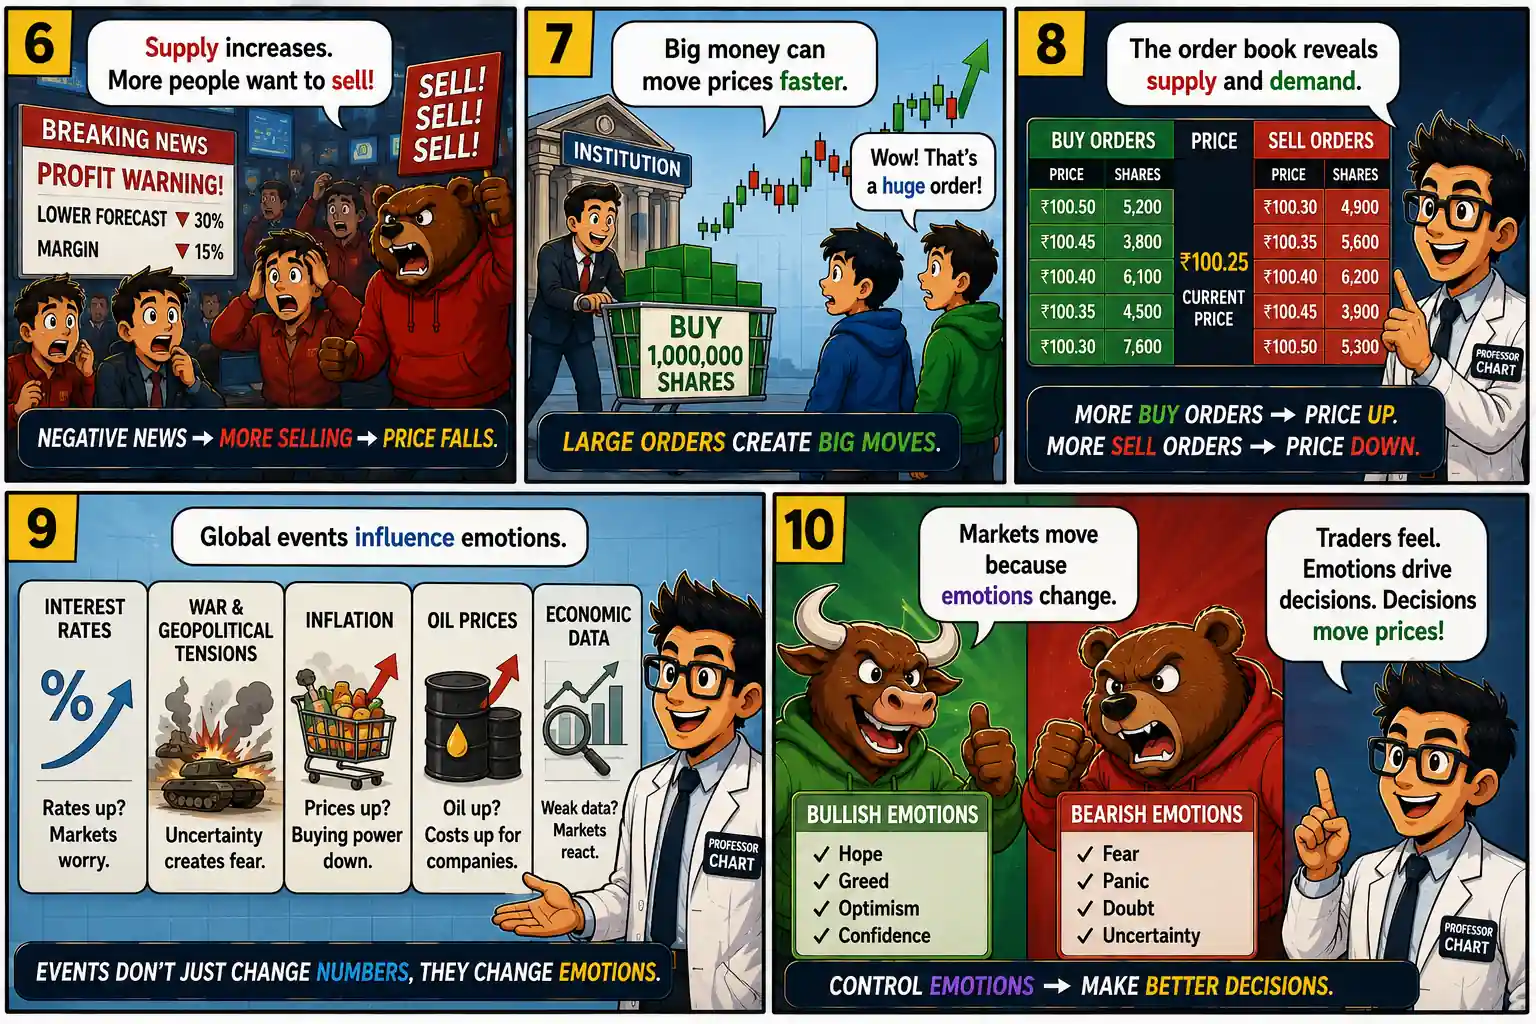
Every stock price is determined by the continuous interaction between buyers and sellers. When demand for a stock is greater than the available supply, buyers compete by offering higher prices, causing the stock to rise. On the other hand, when more investors want to sell than buy, sellers accept lower prices, leading to a decline.
Several factors influence this balance. Positive company earnings, new product launches, government policies, lower interest rates, and optimistic market sentiment often encourage buying. Negative news, disappointing financial results, economic uncertainty, geopolitical tensions, or rising interest rates can increase selling pressure. Large institutional investors, such as mutual funds and pension funds, can also create significant price movements because of the size of their transactions.
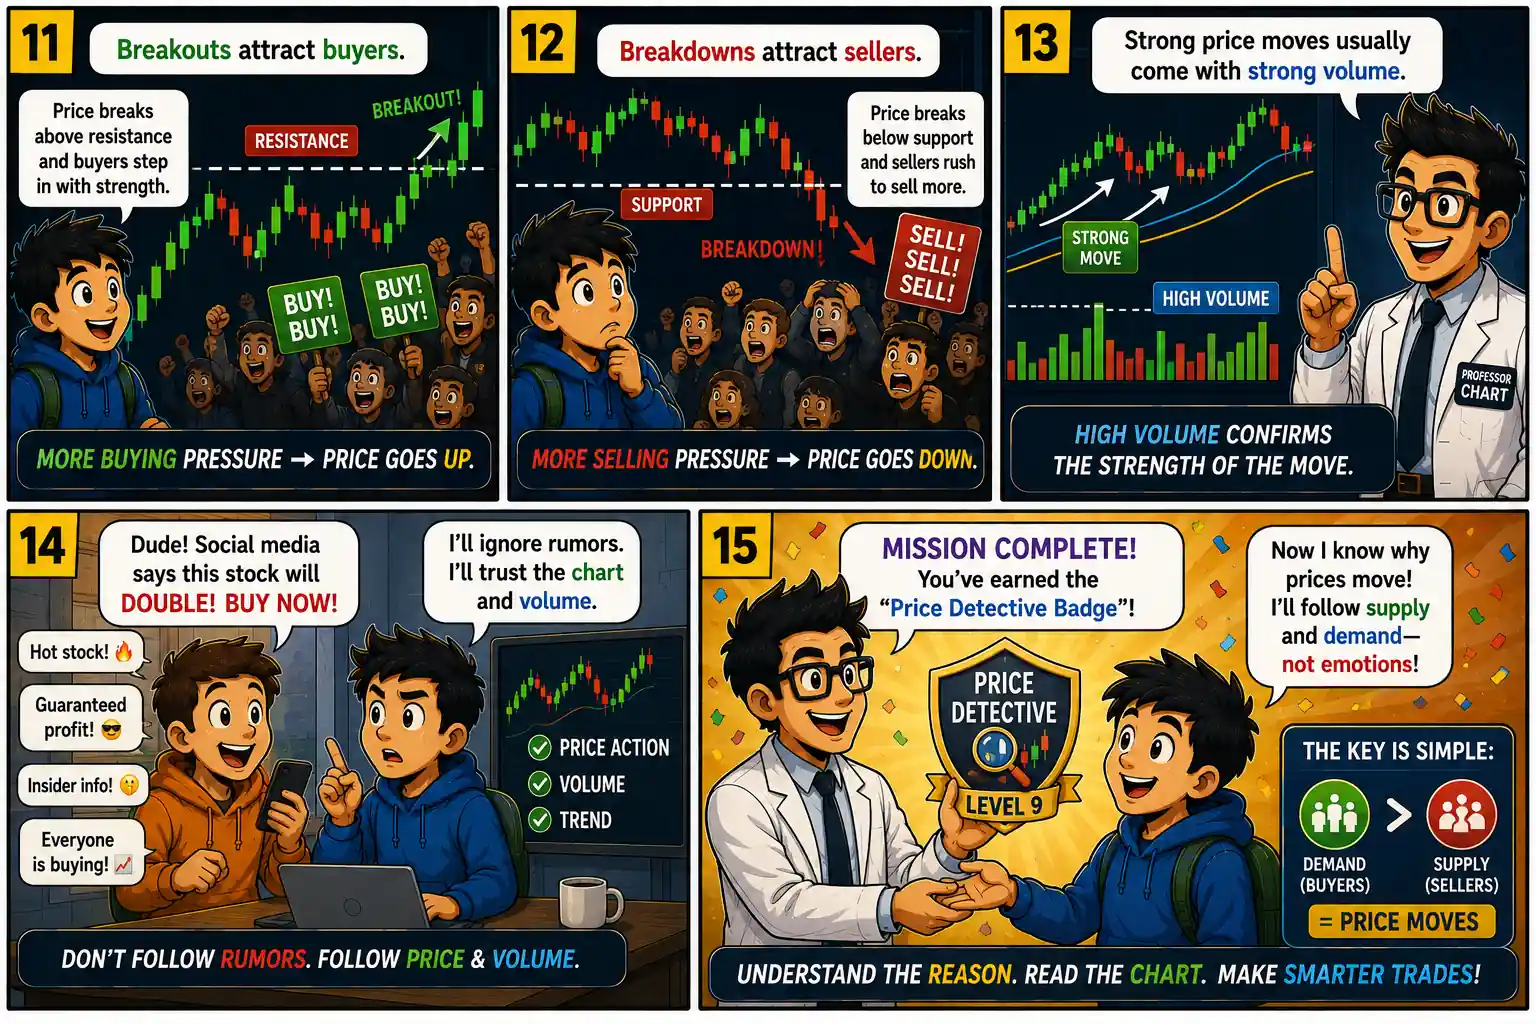
Technical analysts focus on price action and trading volume rather than trying to predict future events. Price shows who is currently winning the battle between buyers and sellers, while volume reveals the strength behind that movement. A strong price increase supported by high trading volume is generally considered more reliable than a move with low volume.
Support and resistance levels also play an important role. A breakout above resistance often signals growing buying interest, while a breakdown below support may indicate increasing selling pressure. However, no indicator guarantees future results. Successful traders always combine chart analysis with proper risk management and disciplined decision-making.
The most important lesson is that markets are driven by human behavior. Fear, greed, optimism, and uncertainty influence every trading decision. By learning to understand supply, demand, price action, and volume, traders can make better-informed decisions instead of reacting emotionally or following rumors. Technical analysis does not eliminate risk, but it helps investors recognize opportunities, manage uncertainty, and develop a structured approach to participating in the stock market.