Chart Mission 7 – Market Sessions

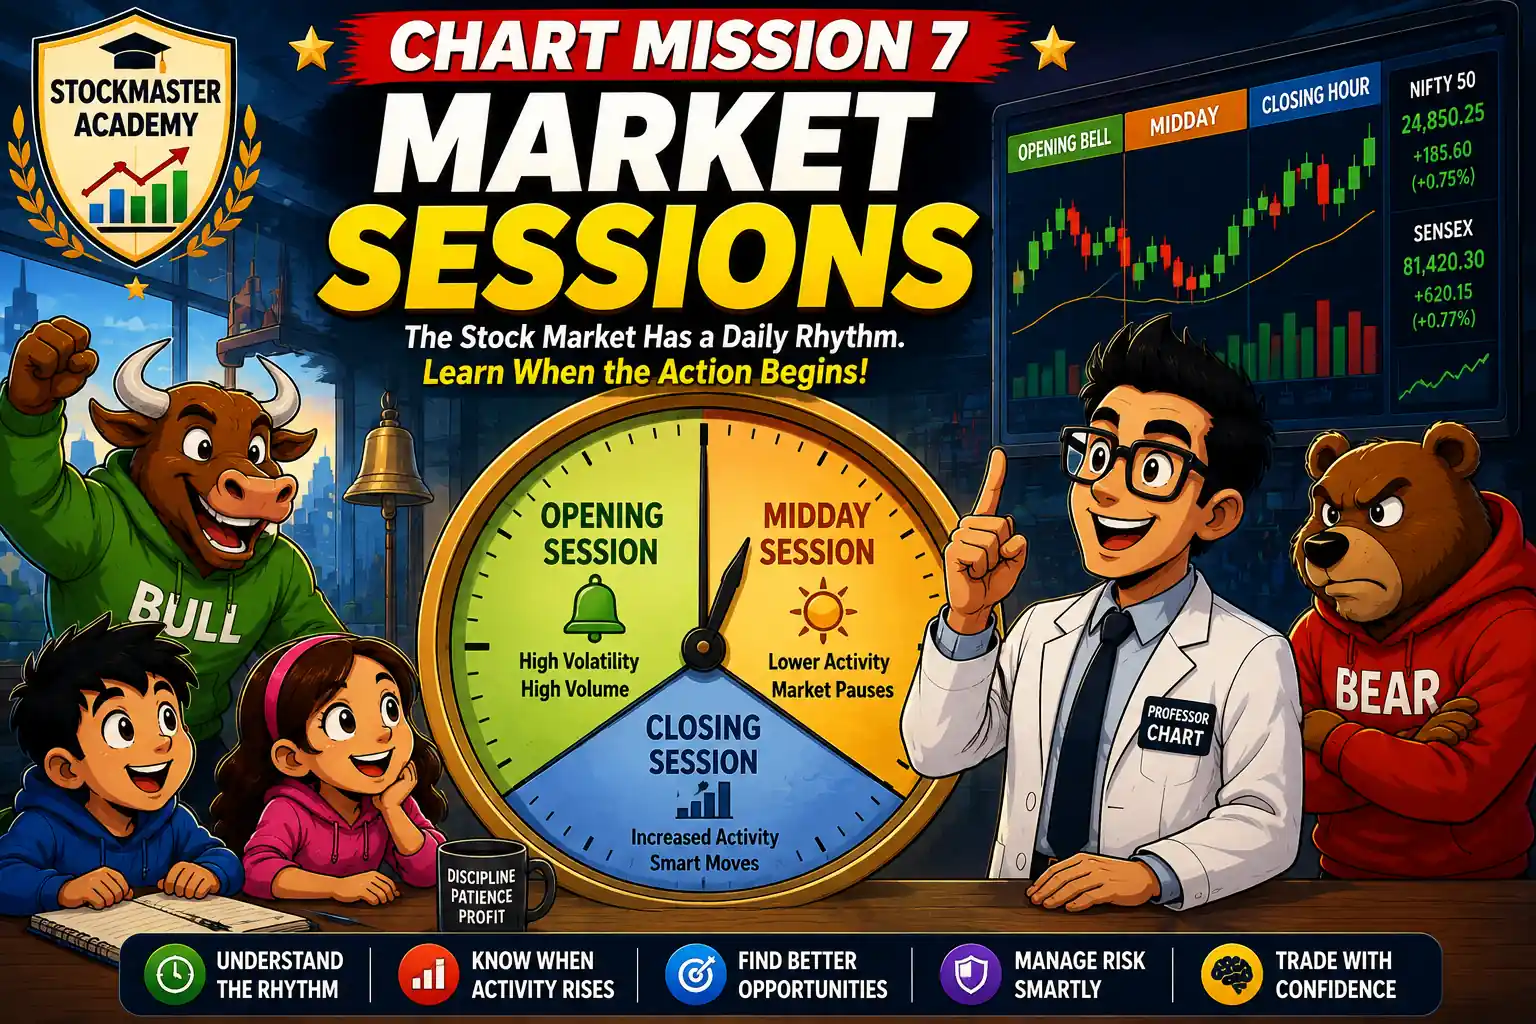
Chart Mission 7 – Market Sessions hero image showing Professor Chart explaining the opening, midday, and closing stock market sessions with Bull, Bear, and students at StockMaster Academy.

Introduction

After completing several missions at StockMaster Academy, Arjun had learned how to read charts, identify trends, and understand the basics of technical analysis. He believed he was finally ready to become a successful trader.

The next morning, he arrived at the academy before sunrise, expecting the market to behave the same way throughout the day. As soon as the opening bell rang, prices began moving rapidly. Green and red candlesticks appeared one after another, and traders hurried to place their orders.

“Why is everything moving so fast?” Arjun asked in surprise.

Professor Chart smiled and pointed toward a giant trading clock hanging on the academy wall.

“The stock market has its own daily rhythm,” he explained. “Every trading day is divided into different market sessions, and each session has a unique personality.”

With a wave of his hand, the clock transformed into three glowing sections: Opening Session, Midday Session, and Closing Session.

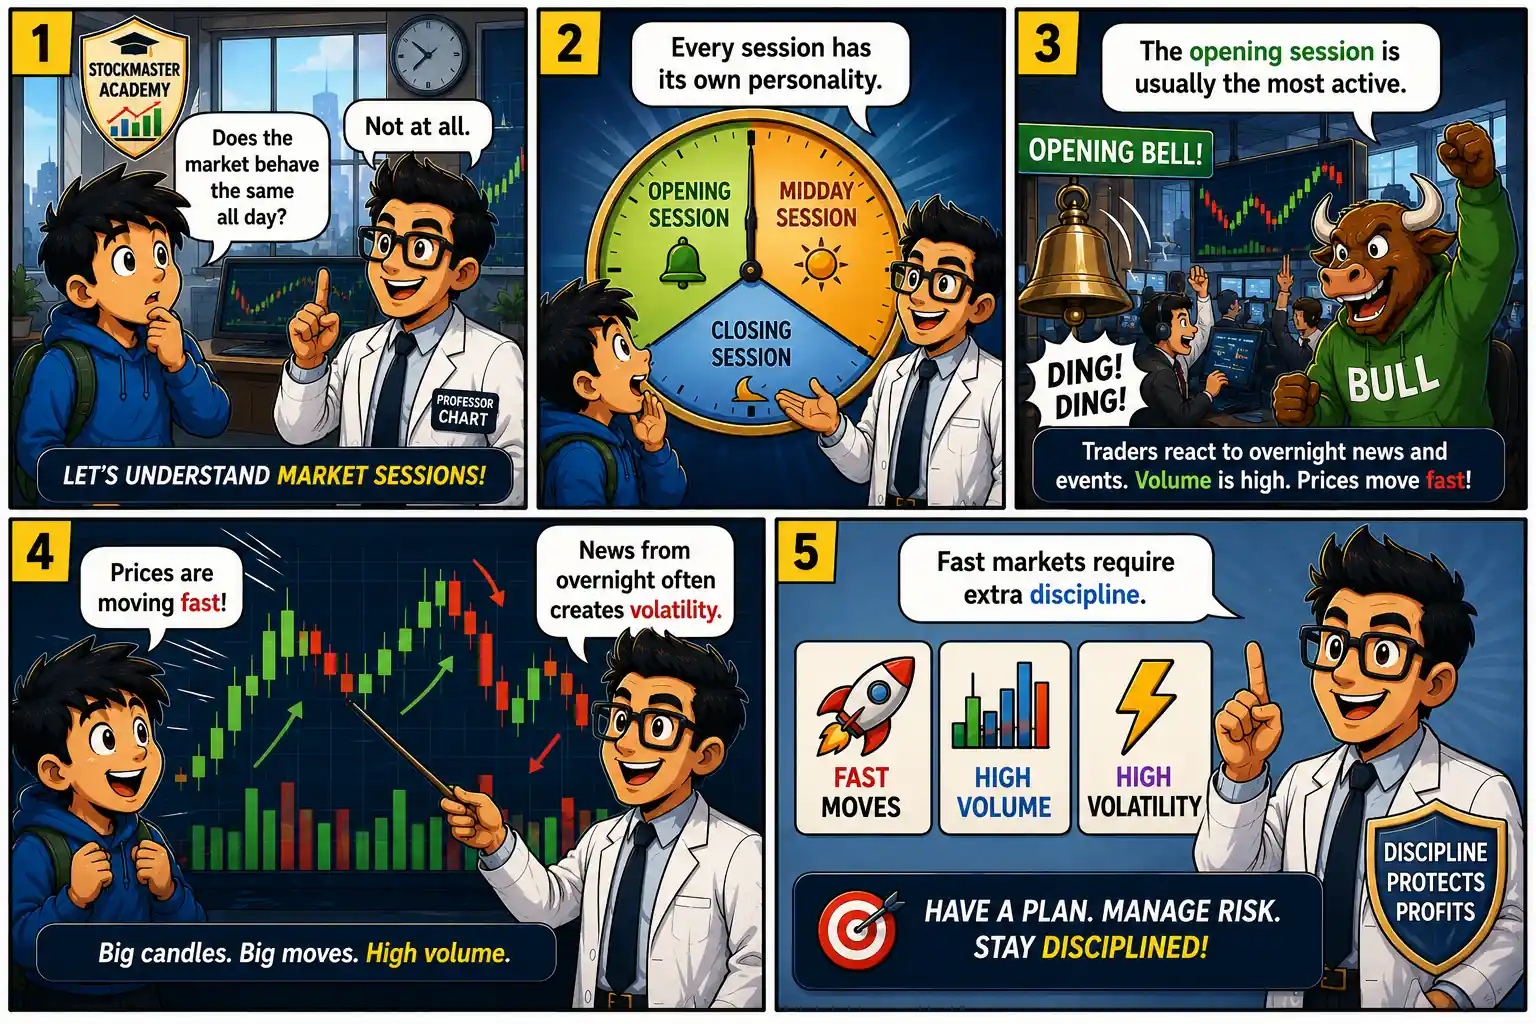
“In the opening session,” Professor Chart continued, “the market reacts to overnight news, company announcements, and global events. This often creates high trading volume and sharp price movements. During the midday session, activity usually slows as many traders wait for stronger opportunities. As the closing bell approaches, the market often becomes active again as institutional investors and professional traders complete their trades.”

Arjun realized something important.

“So, successful traders don’t just study charts—they also understand when the market is most active.”

Professor nodded.

“Exactly. Knowing what the chart says is only half the journey. Knowing when to trade can make an equally important difference.”

With that lesson, the academy doors opened once again.

Chart Mission 7: Market Sessions was about to begin.

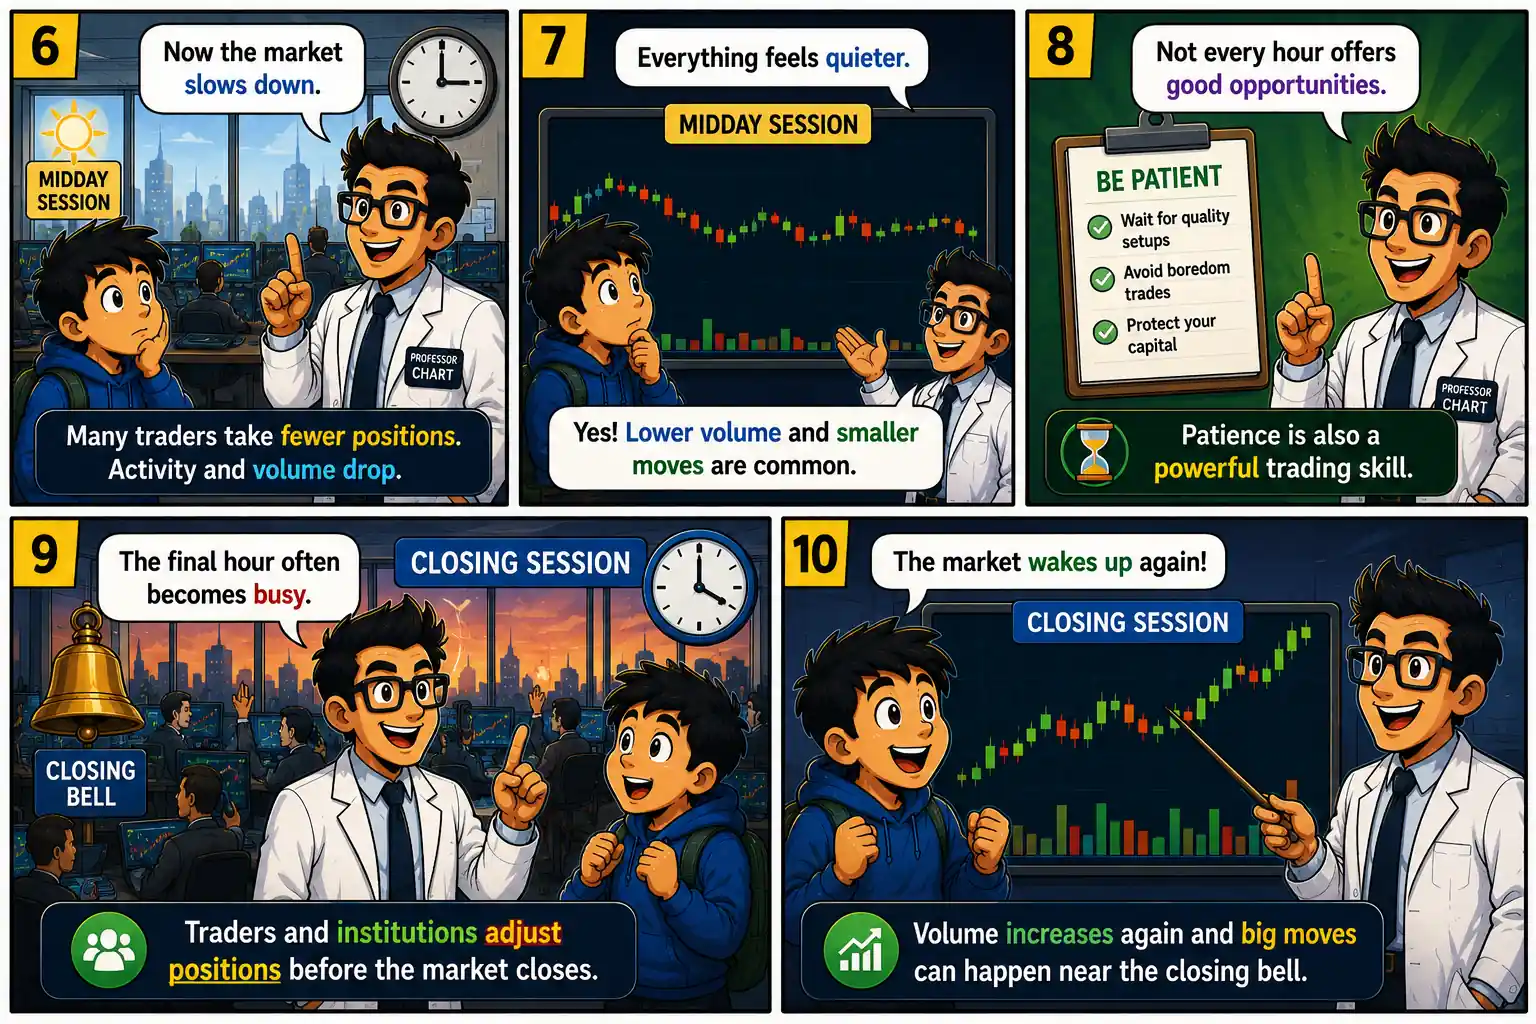
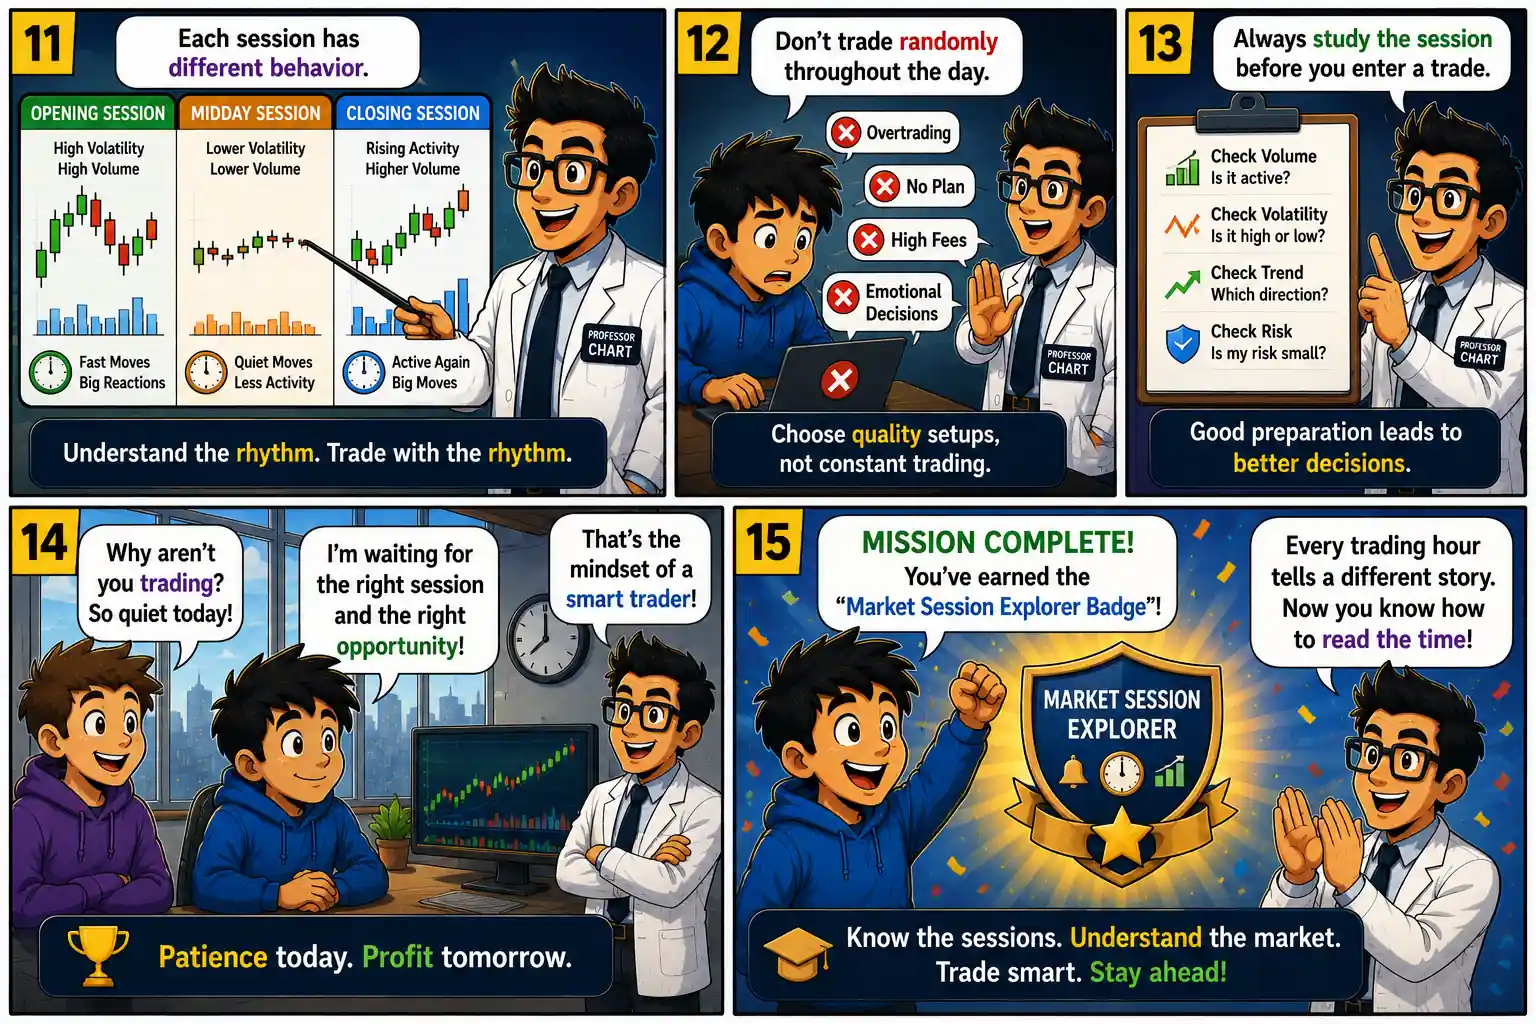
Chart Mission 7 comic panels 1 to 5 introducing market sessions, opening bell activity, overnight news impact, volatility, trading volume, and the importance of discipline. Chart Mission 7 comic panels 6 to 10 explaining the quieter midday session, patience in trading, and increased activity during the market closing session. Chart Mission 7 comic panels 11 to 15 teaching different market session behaviors, trading preparation, patience, and earning the Market Session Explorer badge.

What We Learned

A trading day is divided into different market sessions, and each session behaves differently. The opening session often experiences high volatility and heavy trading volume because traders react to overnight news and fresh information. Midday trading is generally quieter, with lower volume and fewer strong price movements. The final trading session often becomes active again as institutional investors adjust their positions before the market closes.

Understanding these changing conditions helps traders avoid forcing trades during slow periods and focus on times when better opportunities may appear. Successful technical analysis is not only about reading charts—it is also about recognizing when the market environment is most favorable.

Key Takeaways

  • 🕒 The market changes throughout the trading day.
  • 🔔 Opening session usually has the highest volatility.
  • 😌 Midday is often slower and quieter.
  • 📈 Closing session frequently sees increased activity.
  • 🎯 Good traders adapt their strategy to market conditions.
  • 🛡️ Patience is an important trading skill.

Vocabulary

Market Session – A specific part of the trading day.

Opening Bell – The start of market trading.

Closing Bell – The end of regular trading.

Volatility – The speed and size of price movements.

Volume – The number of shares traded.

Smart Investor Tip 

Professional traders don’t trade every minute—they trade when the market offers the best opportunities.

Next Chart Mission Preview

Chart Mission 8 – Chart Patterns vs Reality

Arjun thought chart patterns were magical shapes that always predicted the future. But Professor Chart had a different lesson in mind. “A pattern is only a clue—not a guarantee,” he explained as familiar formations like triangles, flags, and head & shoulders appeared on the academy’s giant screen. Some patterns led to powerful breakouts, while others failed completely, trapping impatient traders. In the next mission, you’ll discover why successful traders never trust a pattern blindly. Instead, they combine chart patterns with volume, trend, and risk management to separate high-probability opportunities from false signals. Get ready to uncover the truth behind one of technical analysis’s biggest myths in Chart Mission 8 – Chart Patterns vs Reality.

Scroll to Top