Introduction
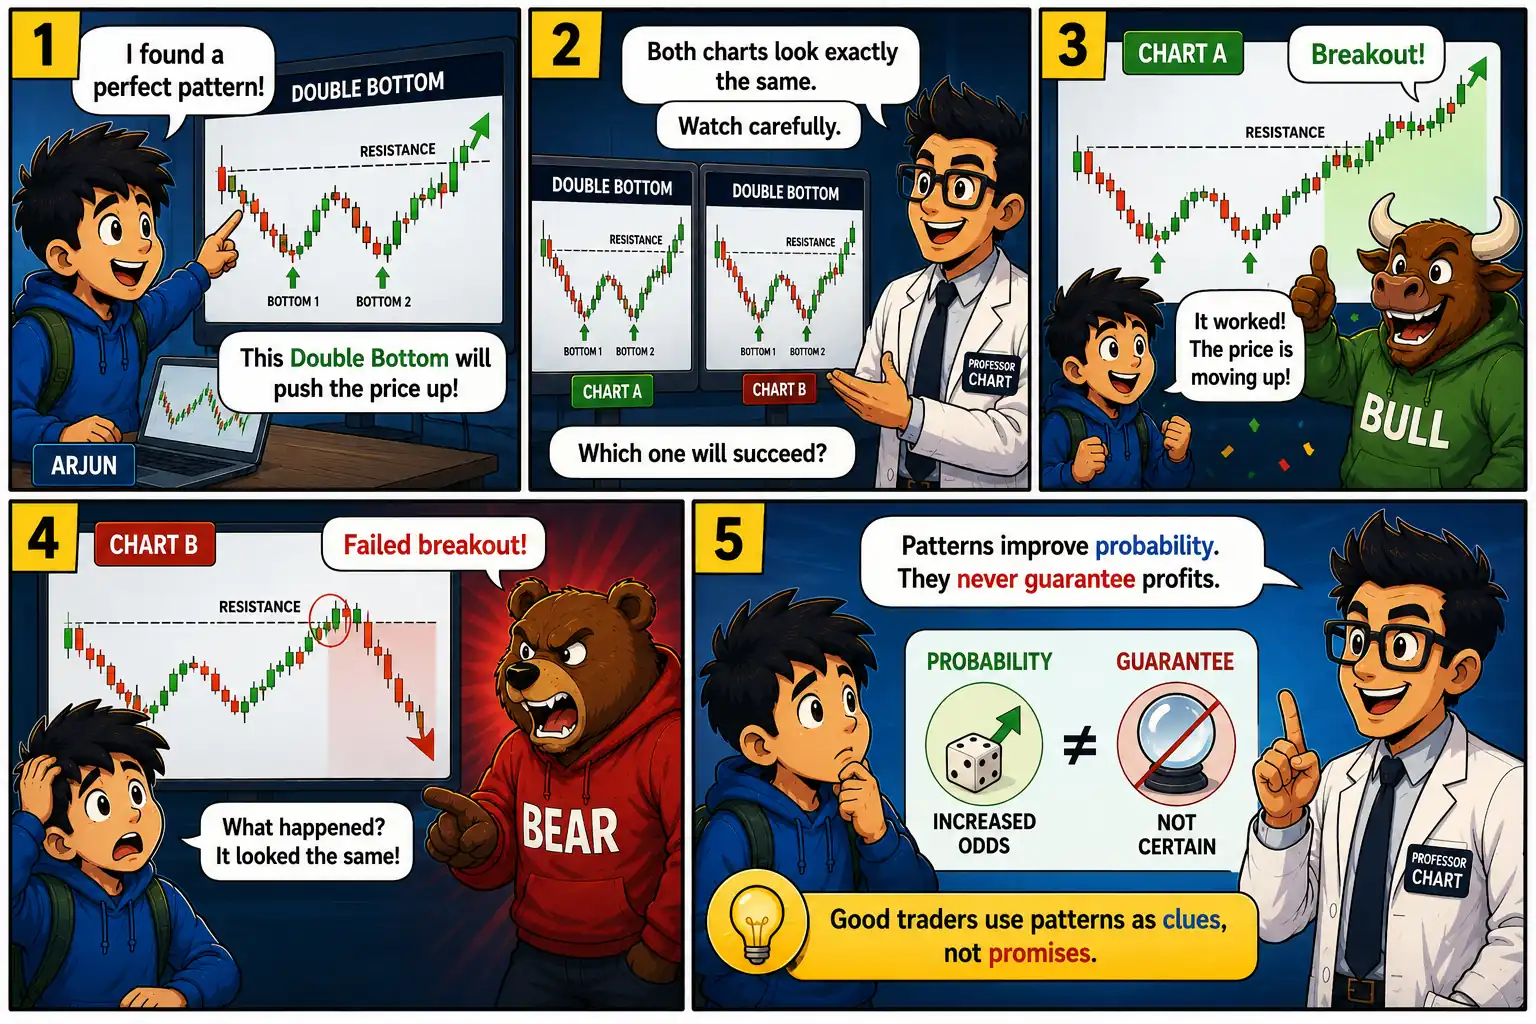
Arjun had become increasingly confident after completing several chart missions at StockMaster Academy. He had learned about trends, candlesticks, support, and resistance. One afternoon, while analyzing a stock chart, he spotted what looked like a perfect Double Bottom pattern.
“This is easy!” he said excitedly. “The price is definitely going up now.”
Professor Chart smiled but didn’t answer. Instead, he projected two nearly identical stock charts onto a giant screen. Both showed the same Double Bottom pattern. Both looked equally convincing.
“Tell me,” the professor asked, “which one will succeed?”
Arjun confidently pointed to both.
“They’ll both break out!”
Professor Chart clicked a button. On the first chart, the stock broke above resistance and continued rising strongly. The class applauded.
Then the second chart came alive. Instead of rising, it briefly moved above resistance before falling sharply below support. Traders who bought the breakout were trapped.
Arjun stared at the screen in disbelief.
“But… both charts looked exactly the same!”
Professor Chart nodded.
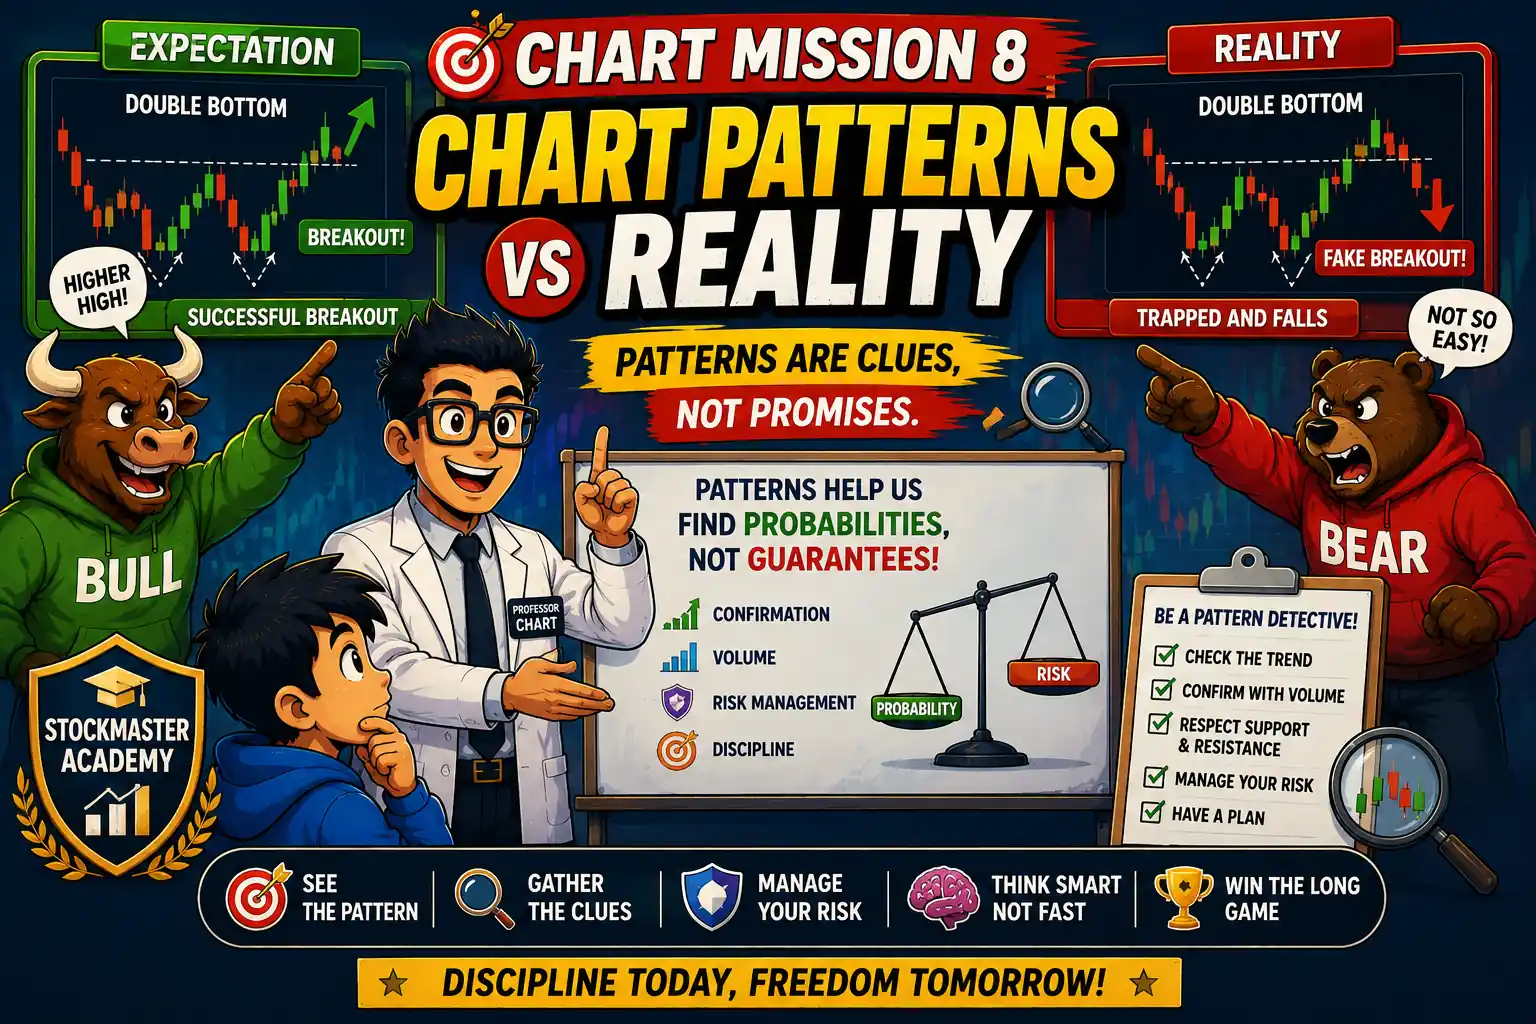
“That’s the lesson every trader must learn. Chart patterns don’t predict the future. They simply tell us what is more likely to happen based on history.”
He continued, “Markets are influenced by news, emotions, institutions, global events, and thousands of buyers and sellers making decisions every second. No pattern can control those forces.”
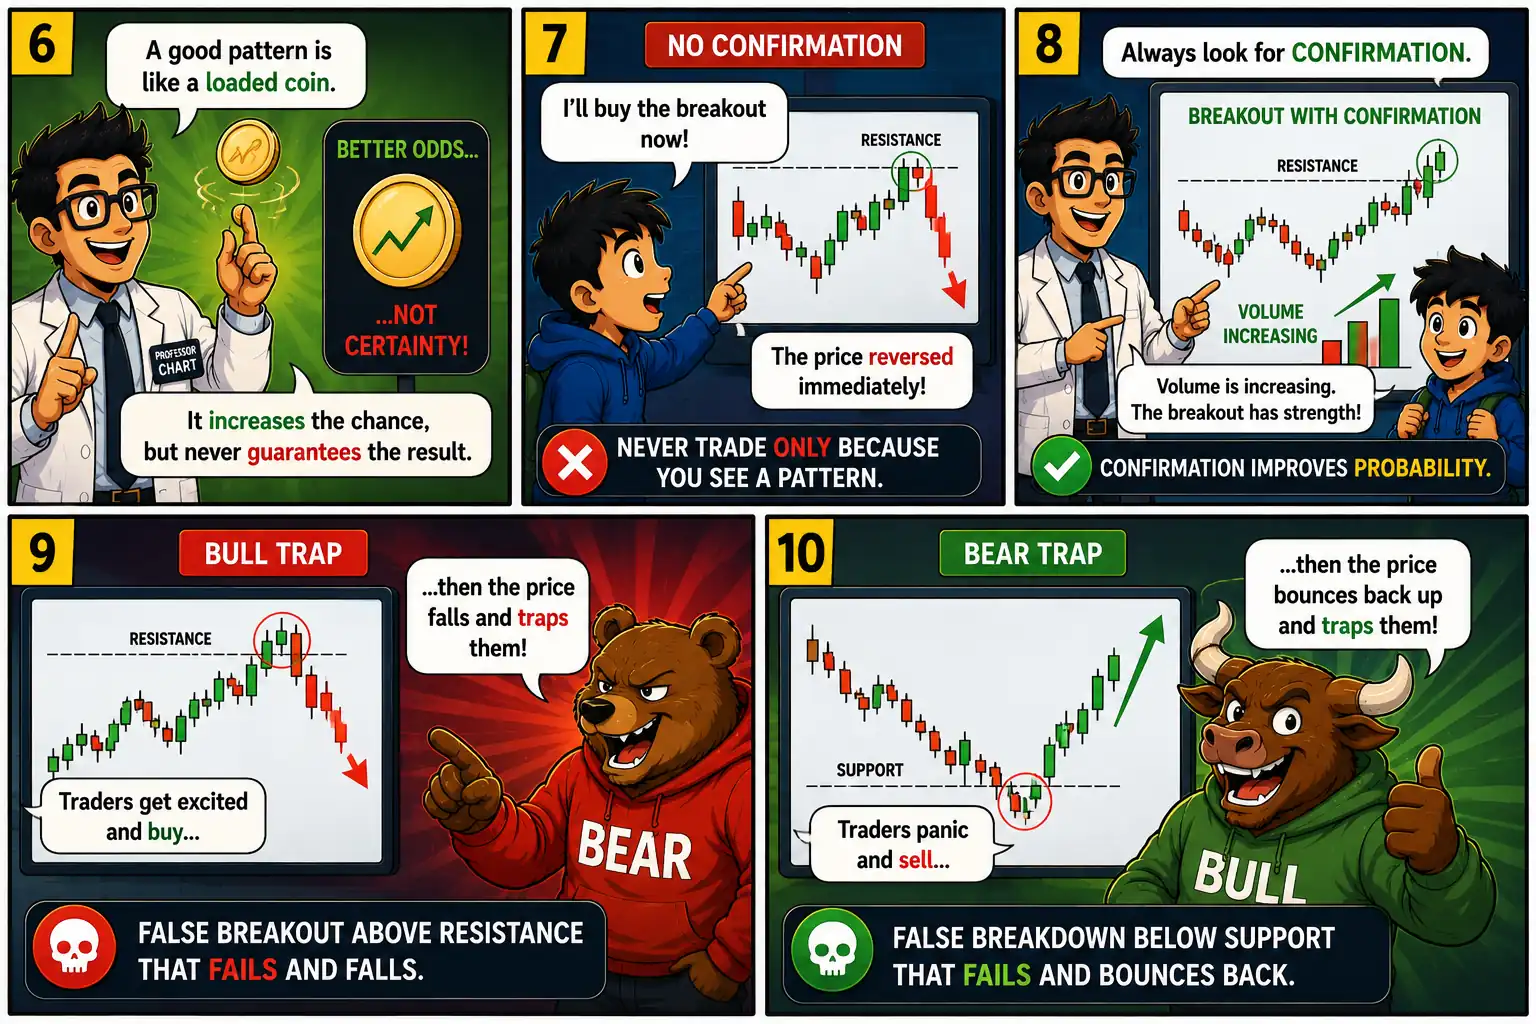
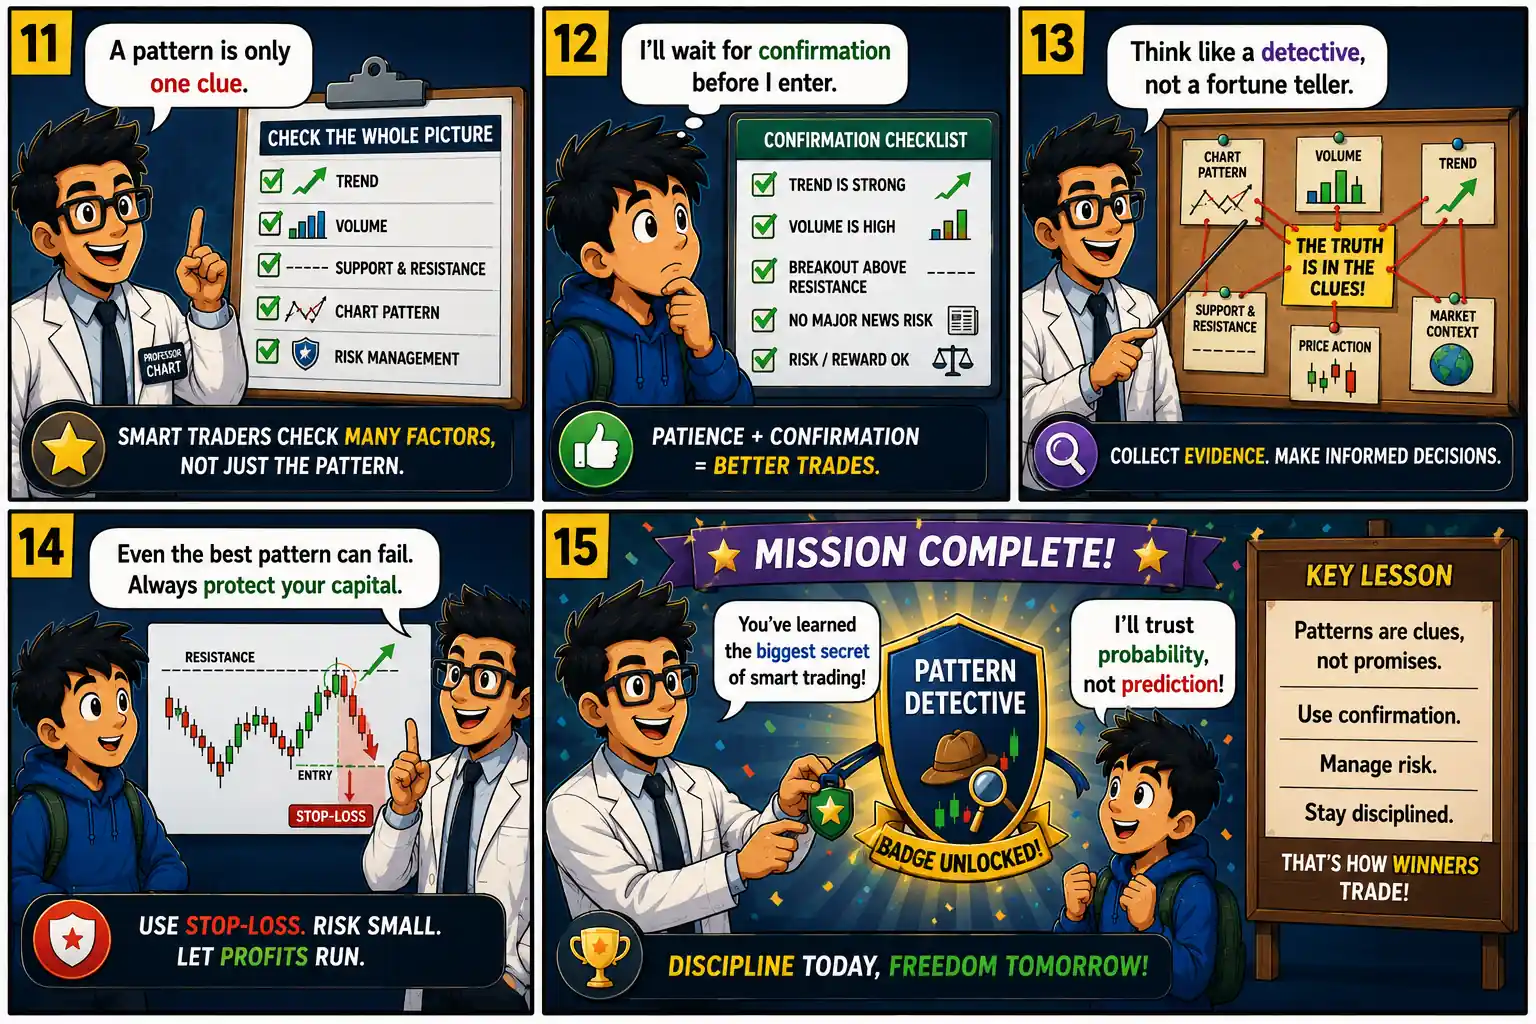
Arjun finally understood that successful traders don’t blindly trust patterns. They combine chart patterns with confirmation, volume, trend analysis, and disciplined risk management. The mission was not about finding certainty—it was about making smarter decisions under uncertainty.