
Chart Mission 1 – What Is Technical Analysis?

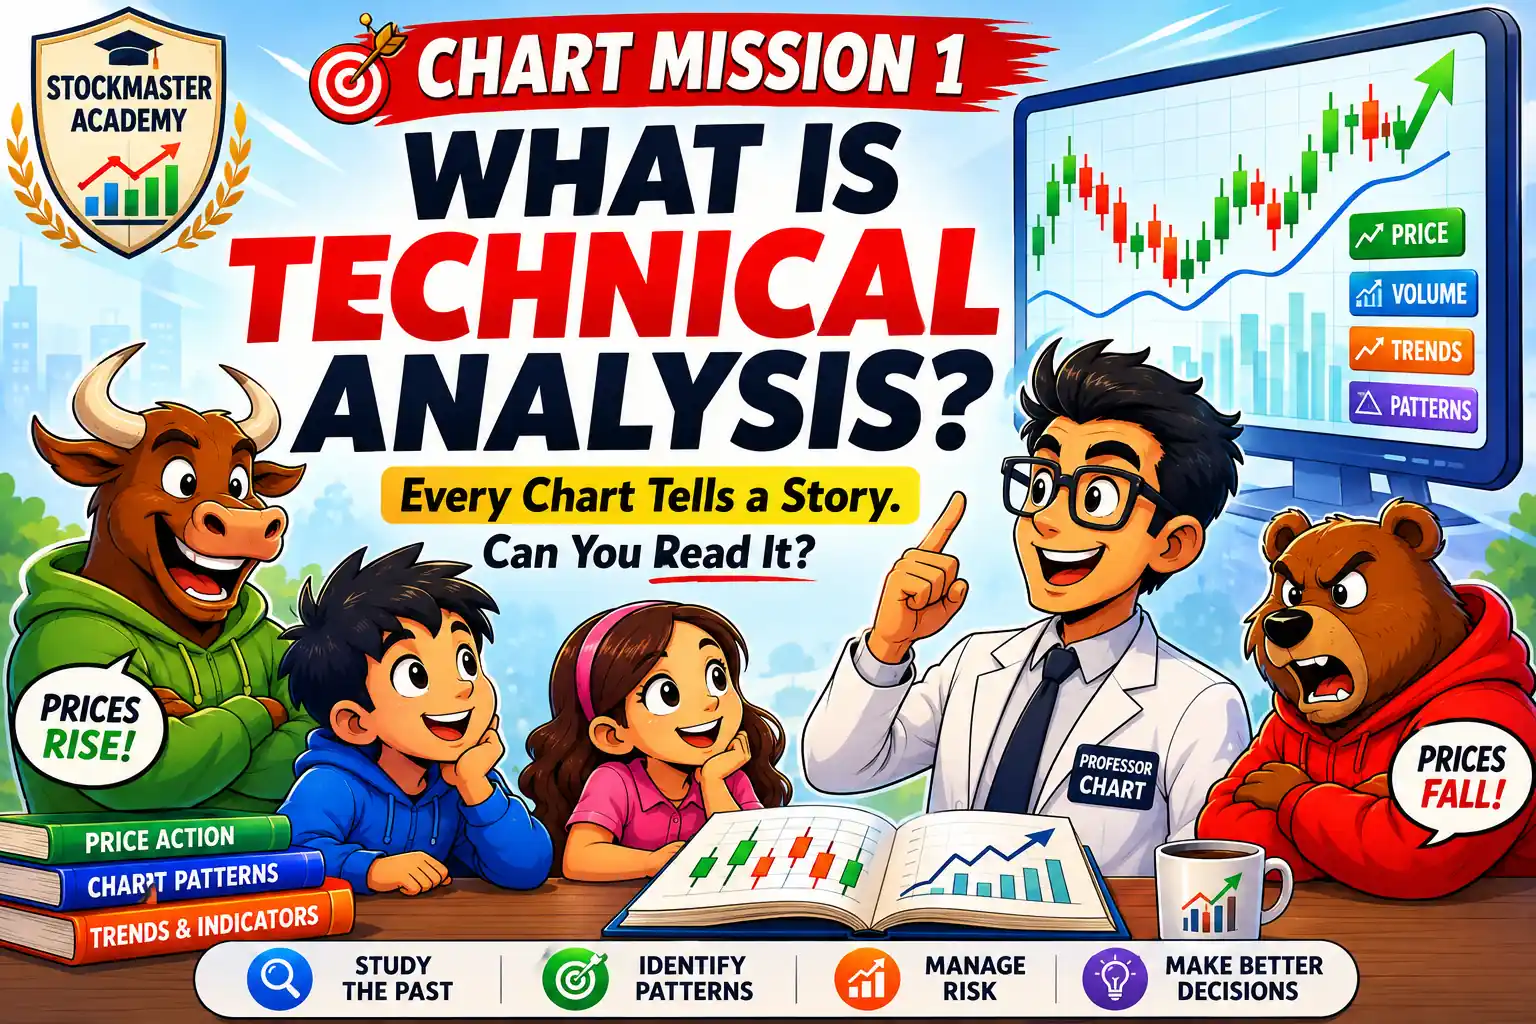
Chart Mission 1 – What Is Technical Analysis? StockMaster Academy comic hero image featuring Professor Chart, Bull, Bear, and students learning stock chart analysis.

Introduction

Arjun had always wondered how traders seemed to know when prices might rise or fall.

One day he entered the legendary Chart Academy, where every wall displayed moving stock charts.

Professor Chart smiled.

“Many people think traders predict the future.”

Arjun nodded.

Professor laughed.

“No one can predict the future perfectly. Technical analysis isn’t magic—it is the art of studying price movements and market behavior to make better decisions.”

A giant chart lit up.

The first mission had begun.

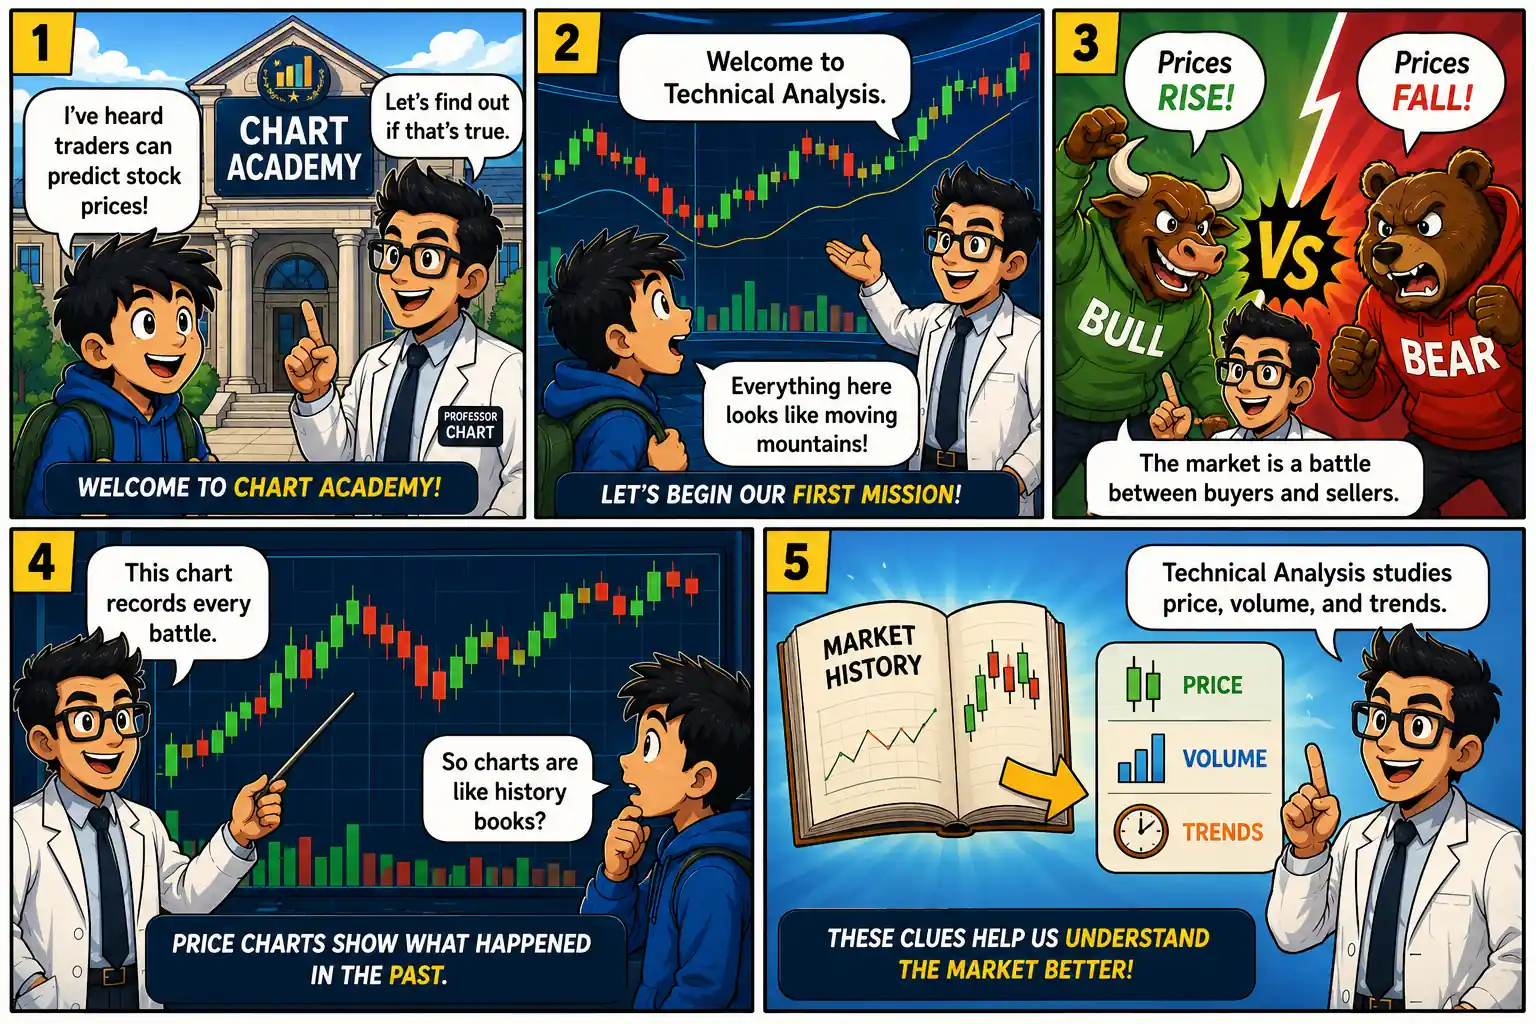
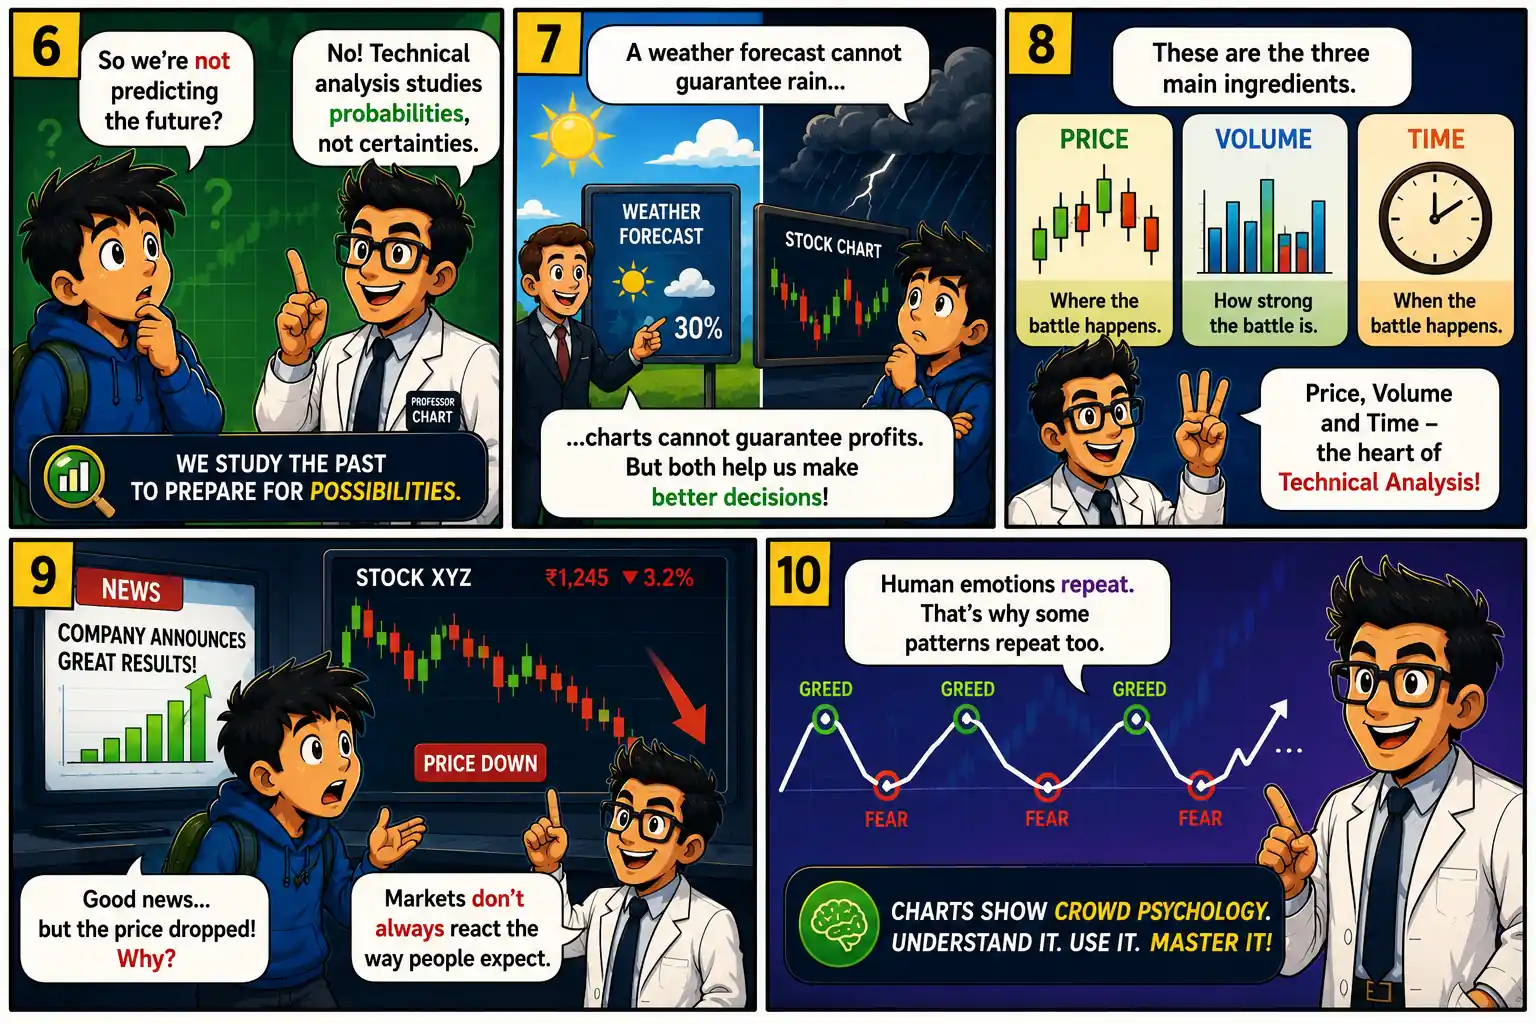
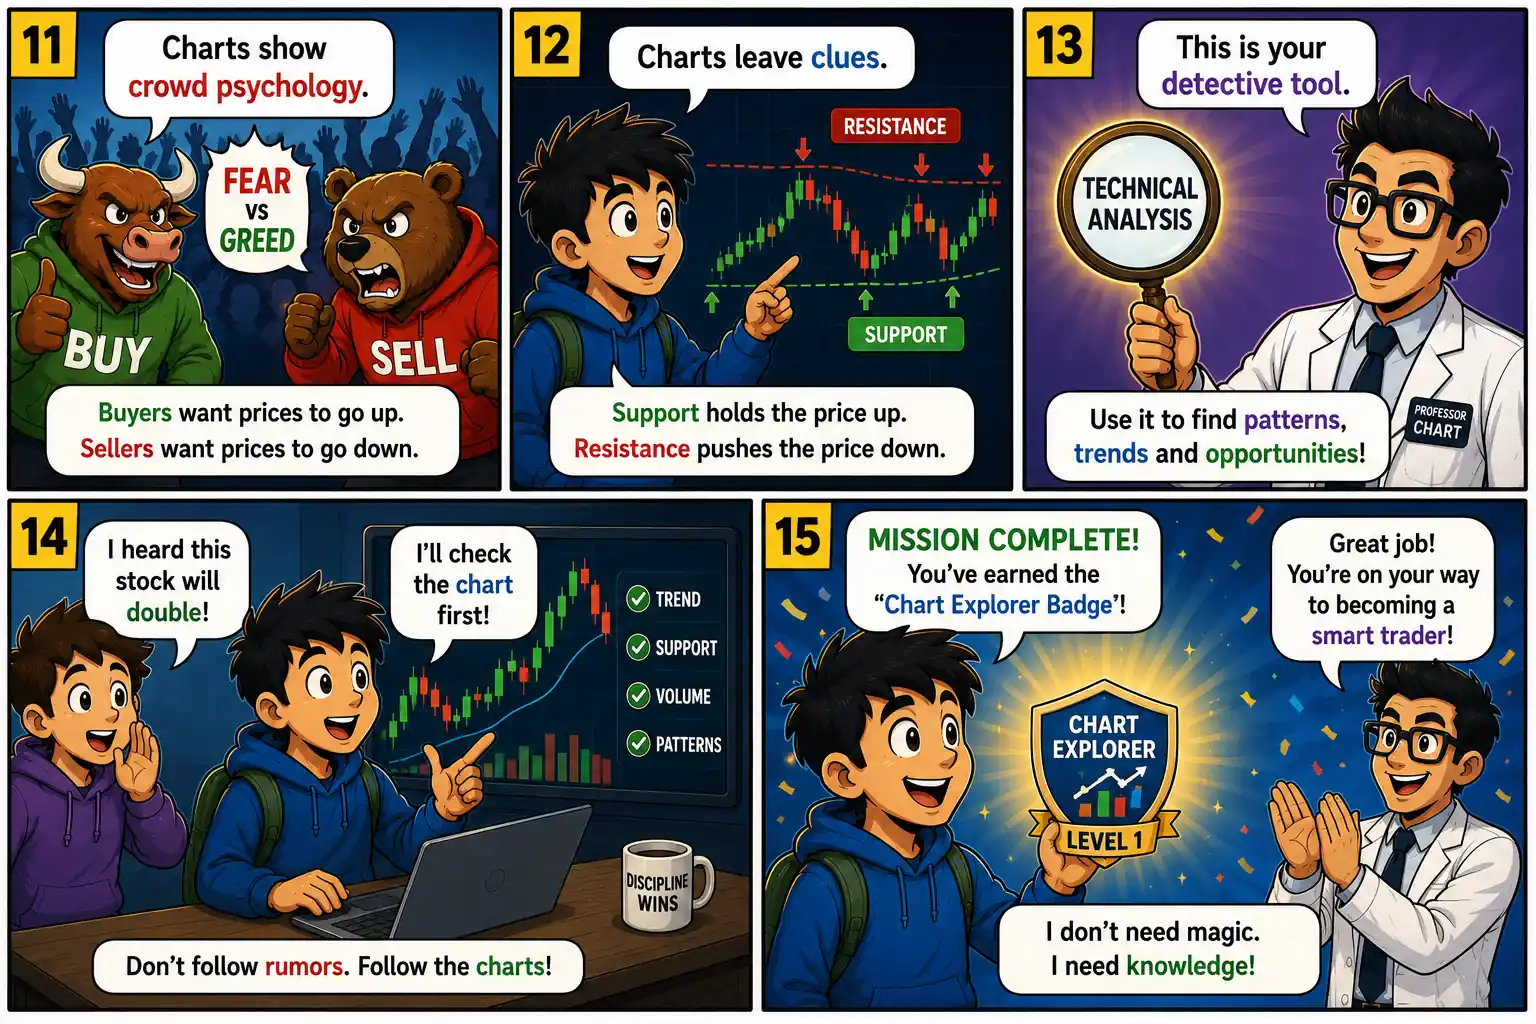
Chart Mission 1 comic panels 1 to 5 introducing technical analysis, Chart Academy, market battles, price charts, and the basics of price, volume, and trends. Chart Mission 1 comic panels 6 to 10 explaining probabilities, weather forecast analogy, price, volume, time, market reactions, and crowd psychology. Chart Mission 1 comic panels 11 to 15 showing support and resistance, technical analysis tools, avoiding rumors, and earning the Chart Explorer badge.

What We Learned

Technical analysis is the study of historical market data—primarily price, volume, and trends—to identify possible future market behavior. It does not predict the future with certainty. Instead, it helps traders evaluate probabilities, manage risk, and make more informed decisions.

A chart reflects the combined actions of buyers and sellers. By learning to read those movements, traders can identify trends, support and resistance, momentum, and recurring patterns influenced by human psychology.

Successful technical analysis focuses on discipline and risk management rather than certainty.

Key Takeaways

  • 📈 Technical analysis studies price movement.
  • 📊 Charts reflect buyer and seller activity.
  • 🔍 Price, volume, and time are the core elements.
  • 🎯 Technical analysis estimates probabilities, not guarantees.
  • 🧠 Market psychology often creates repeating patterns.
  • 🛡️ Risk management is as important as chart reading.

Vocabulary

Technical Analysis – Studying charts to make trading decisions.

Price – The value at which a stock trades.

Volume – The number of shares traded.

Trend – The overall direction of price movement.

Probability – The likelihood of an event happening.

Smart Investor Tip

Great traders don’t ask, “What will happen?” They ask, “What is the most likely outcome, and how much risk am I take if I’m wrong?”

Next Chart Mission Preview

Chart Mission 2 – What Is Money Made Of?

Arjun is fascinated by the moving charts inside Chart Academy. Are they just colorful lines and candles, or do they reveal the real story of the market? Join Professor Chart as he explains why price is the language of buyers and sellers, how every candlestick records a market battle, and why traders trust price action more than rumors or predictions.

Coming next: Chart Mission 2 – Price Tells a Story

Scroll to Top