
Chart Mission 10 – The Language of Charts

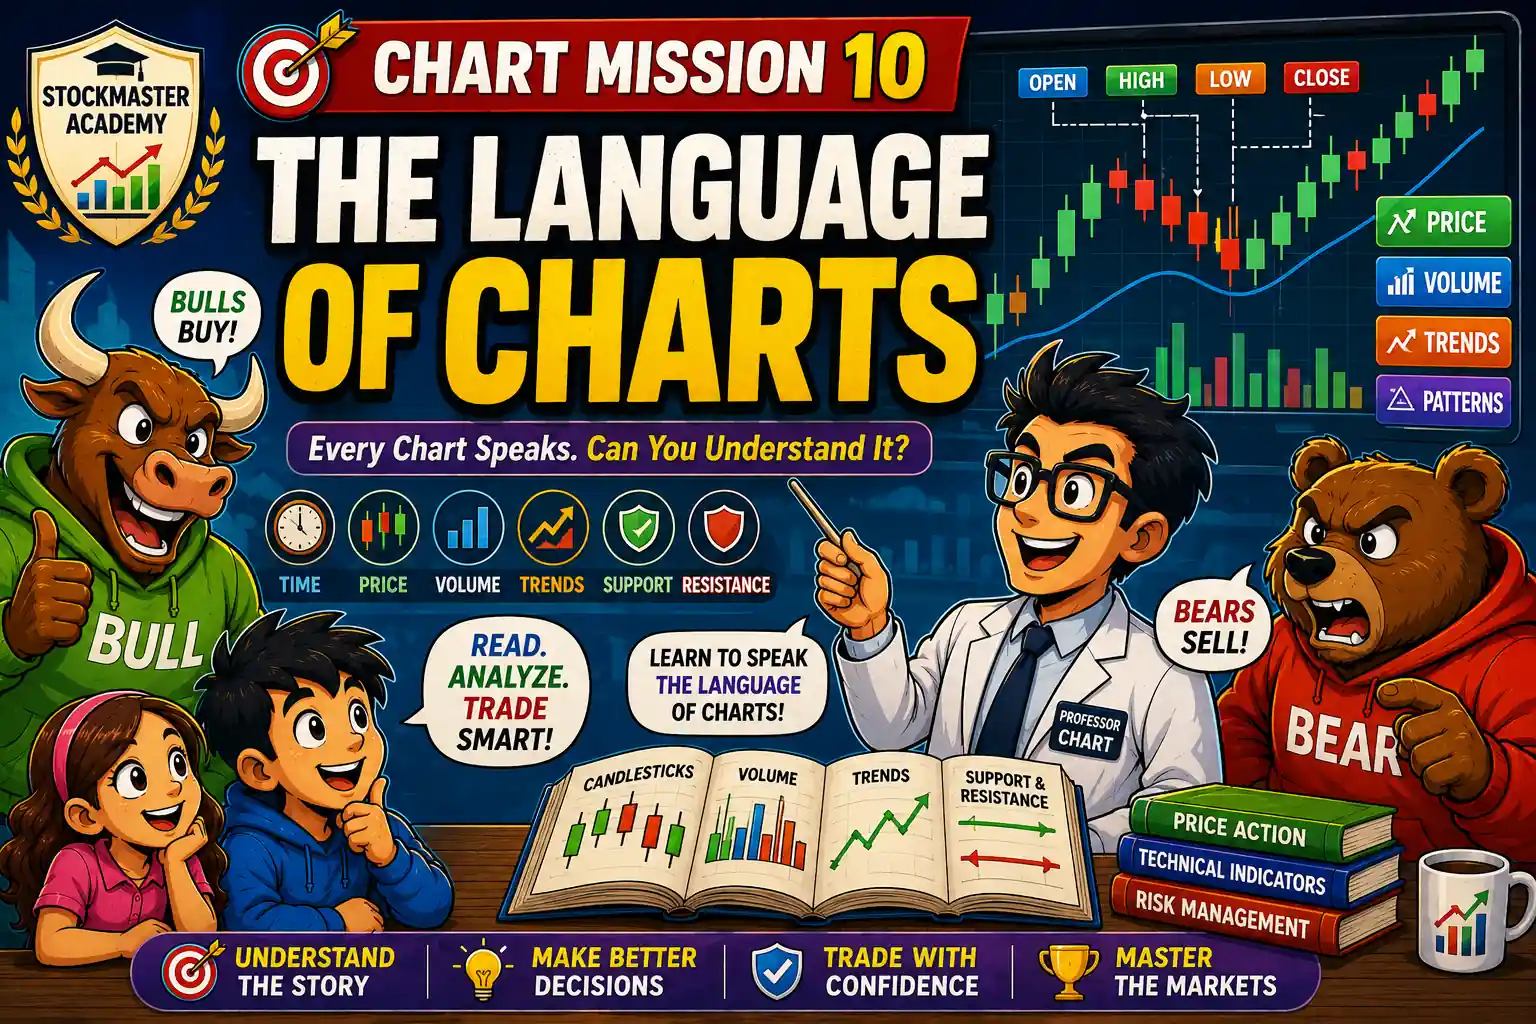
Chart Mission 10 – The Language of Charts hero image featuring Professor Chart teaching candlesticks, price, volume, trends, support, resistance and technical analysis basics.

Introduction

Arjun had completed his first nine Chart Missions.

He could now recognise charts, trends and some basic patterns.

But there was one problem.

When experienced traders looked at a chart, they seemed to understand it instantly.

Arjun looked at the same chart and saw…

GREEN CANDLES. RED CANDLES. LINES. BARS. NUMBERS.

“Professor Chart,” Arjun asked, “how do traders understand all these symbols?”

Professor Chart smiled.

“Because charts have their own language.”

He opened a giant screen.

“Today, you’re going to learn to speak it.”

Chart Mission 10 had begun.

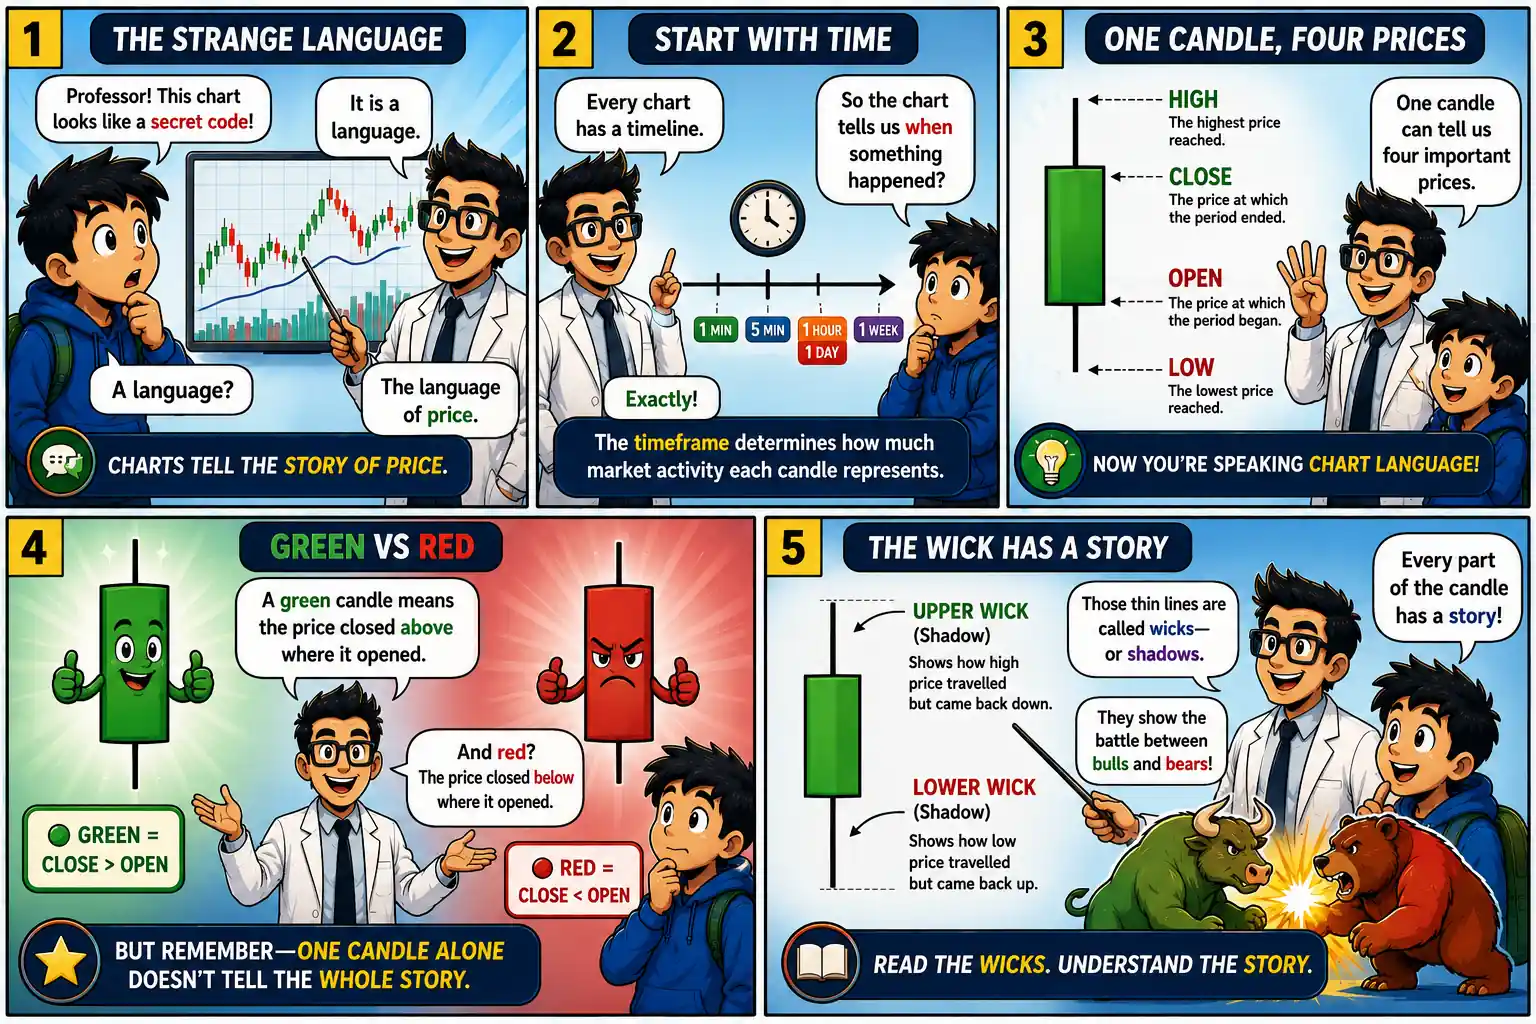
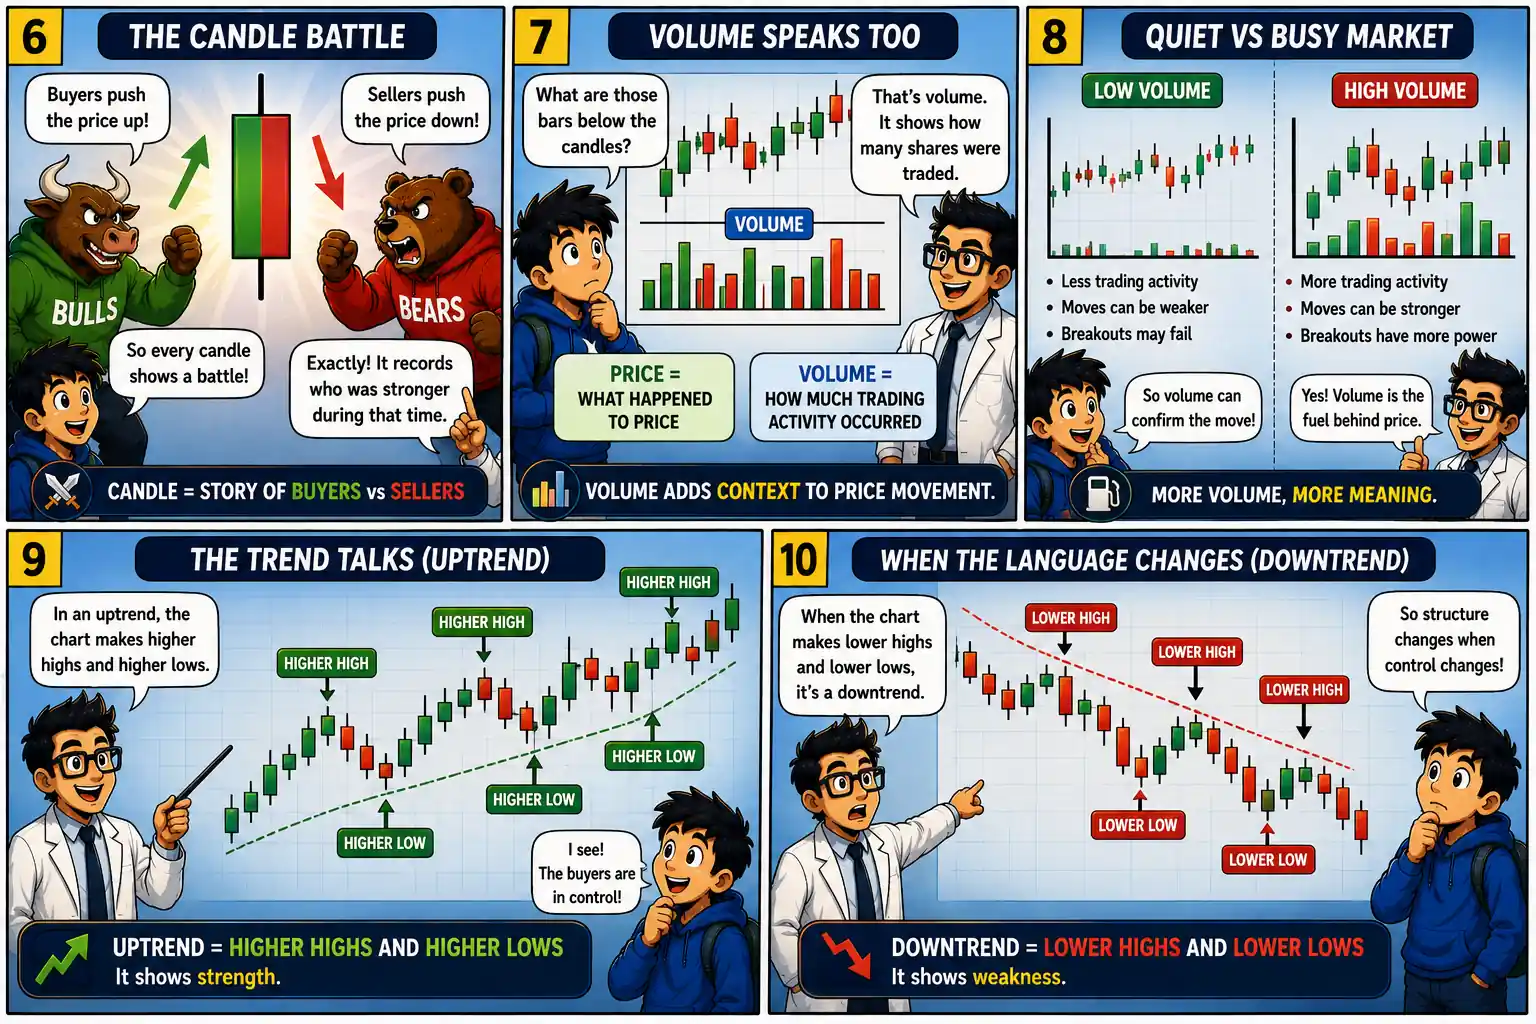
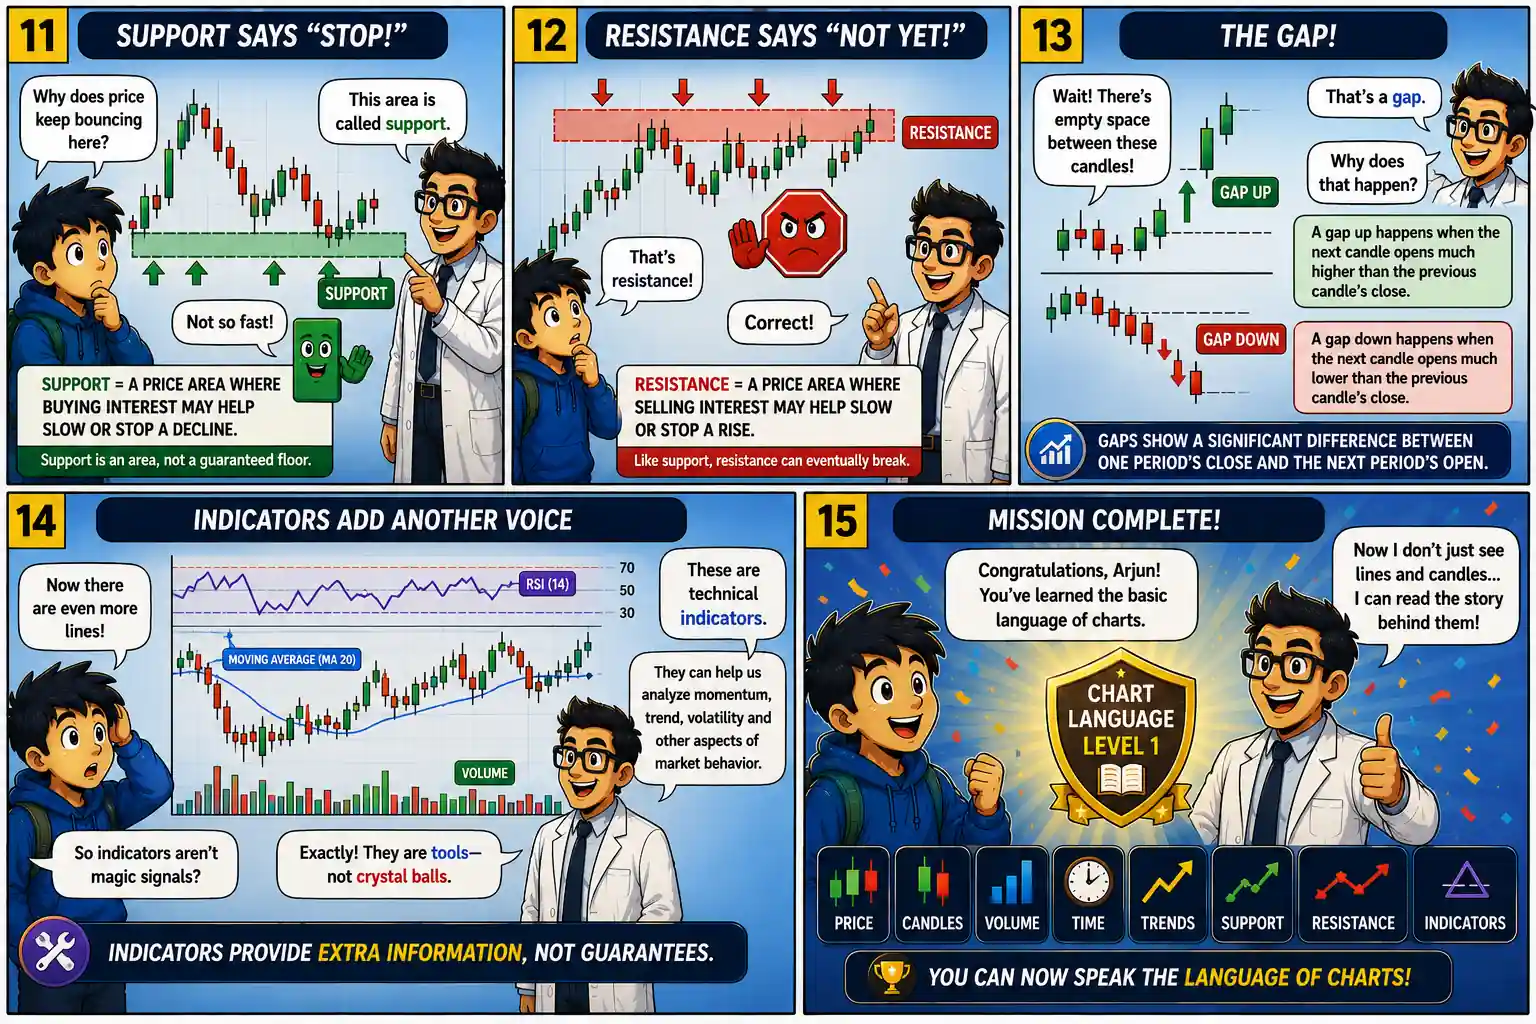
Chart Mission 10 comic panels 1 to 5 explaining the language of stock charts, timeframes, candlesticks, open high low close prices, green and red candles, and candle wicks. Chart Mission 10 comic panels 6 to 10 explaining candle battles, trading volume, market activity, uptrends with higher highs and higher lows, and downtrends with lower highs and lower lows. Chart Mission 10 comic panels 11 to 15 explaining support, resistance, price gaps, technical indicators, and completing the Chart Language Level 1 mission.

What We Learned

A stock chart is more than a picture showing whether a price went up or down. It is a visual language that helps traders organise information about price, time, trading activity and market behaviour.

Candlesticks show the open, high, low and close for a particular period. Their bodies and wicks provide clues about how buyers and sellers behaved during that period.

Volume adds another layer of information by showing how much trading activity occurred.

Trends help traders understand the broader direction of price movement, while support and resistance identify important price areas where buying or selling pressure may appear.

Gaps show significant differences between one period’s close and the next period’s open. Indicators can add additional analytical information, but they should be treated as tools rather than guaranteed prediction systems.

The key skill isn’t memorising every chart symbol.

Key Takeaways

  • 📈 Every stock chart has its own language, and learning it helps you understand market behavior.
  • 🕒 Timeframes show when price movements happened, from minutes to months.
  • 🕯️ Each candlestick tells four important prices: Open, High, Low, and Close (OHLC).
  • 🟢 Green candles generally show buyers were stronger during that period, while 🔴 red candles show sellers had the advantage.
  • 📍 Candle wicks reveal where price traveled before settling at the close.
  • ⚔️ Every candlestick represents the battle between buyers (bulls) and sellers (bears).
  • 📊 Volume measures trading activity and helps confirm the strength of price moves.
  • 📈 Uptrends usually form higher highs and higher lows, while 📉 downtrends form lower highs and lower lows.
  • 🛡️ Support and resistance are important price zones where buying or selling interest may appear—they are not guarantees.
  • ⬆️⬇️ Price gaps can provide clues about strong market sentiment between trading sessions.
  • 🔧 Technical indicators such as Moving Averages and RSI provide additional information, not guaranteed buy or sell signals.
  • 🧠 Great traders don’t memorize charts—they learn to read the story that charts are telling.
  • 🎯 Technical analysis is about understanding probabilities, managing risk, and making better trading decisions—not predicting the future with certainty.

Vocabulary

Candlestick – A visual representation of price movement during a specific period.

Open – The price at which the period begins.

Close – The price at which the period ends.

Wick – The part of a candle showing prices reached above or below the candle body.

Volume – The amount of trading activity during a period.

Trend – The general direction in which price is moving.

Support – A price area where buying interest may emerge.

Resistance – A price area where selling interest may emerge.

Gap – A significant difference between one period’s close and the next period’s open.

Indicator – A mathematical or analytical tool derived from market data.

Smart Investor Tip 

Don’t look at a chart and ask, “Will the price go up?”

First ask, “What is the chart telling me right now?”

Next Chart Mission Preview

Chart Mission 11 – Doji: The Indecision Candle

The market doesn’t always move with confidence. Sometimes buyers push prices higher, sellers pull them lower, and by the end of the session neither side truly wins. This creates a Doji candlestick—one of the most important signals in technical analysis. In the next Chart Mission, Professor Chart will teach Arjun how to recognize different types of Doji candles, what they reveal about market indecision, and why they can sometimes appear just before a trend continues or reverses. Learn how to spot this powerful candlestick and avoid making trading decisions based on a single candle alone.

Coming Next: Chart Mission 11 – Doji: The Indecision Candle

Scroll to Top