Chart Mission 8 – Chart Patterns vs Reality

Chart Mission 8 – Chart Patterns vs Reality hero image showing Professor Chart, Bull, Bear, and Arjun explaining why chart patterns are clues, not guarantees in technical analysis.

Introduction

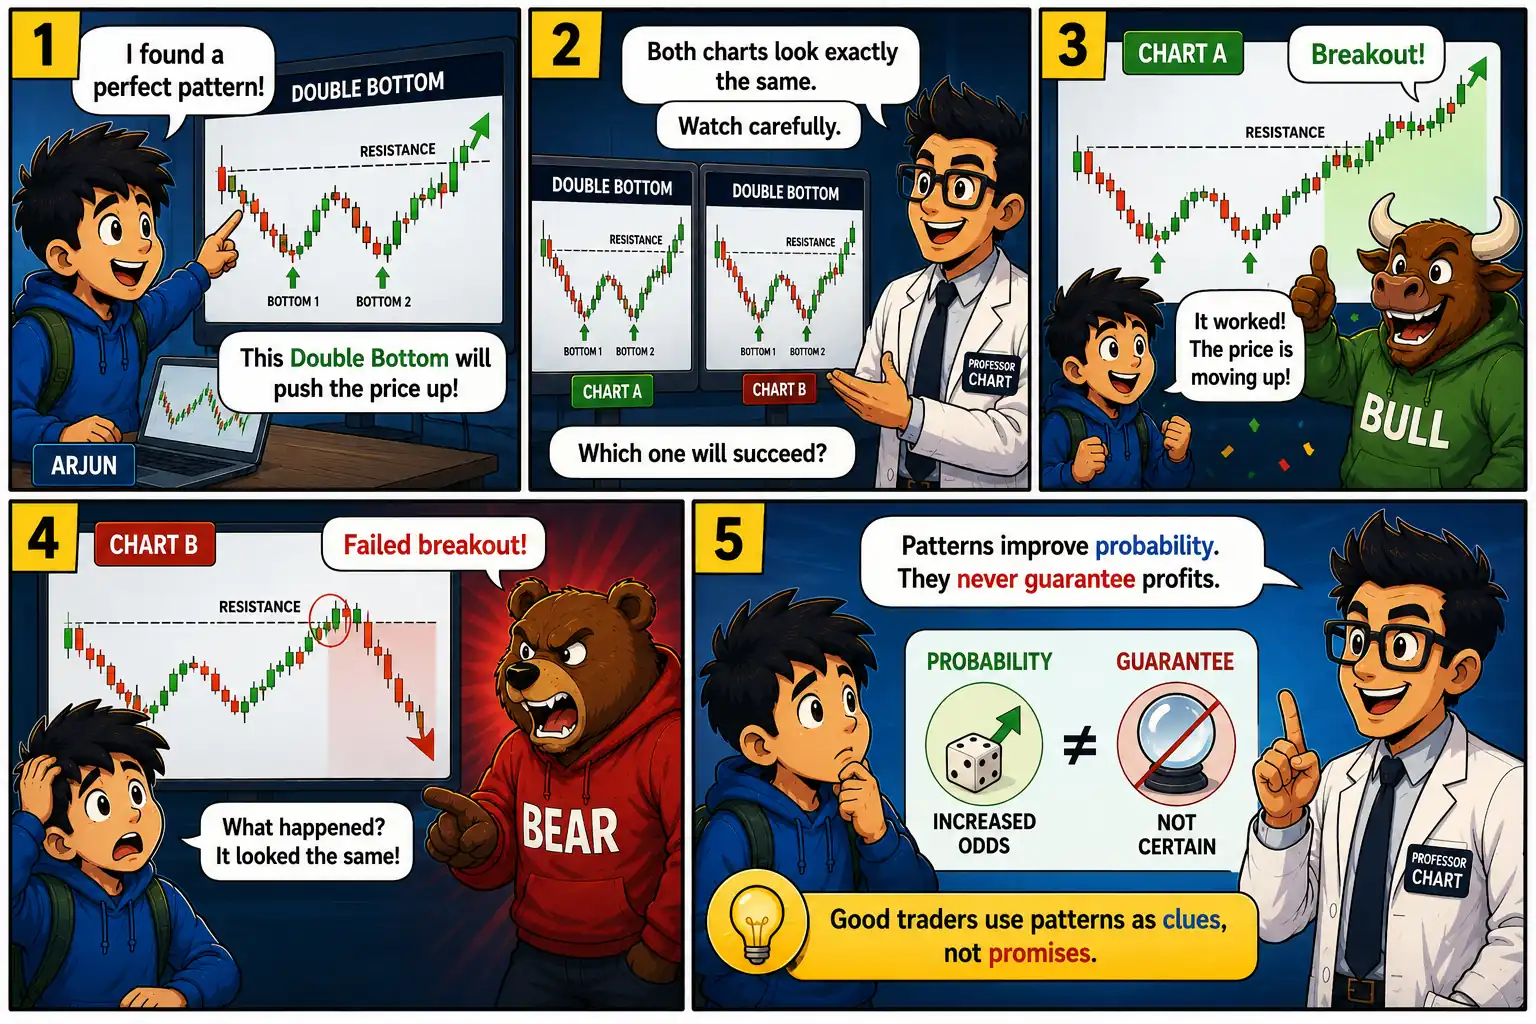
Arjun had become increasingly confident after completing several chart missions at StockMaster Academy. He had learned about trends, candlesticks, support, and resistance. One afternoon, while analyzing a stock chart, he spotted what looked like a perfect Double Bottom pattern.

“This is easy!” he said excitedly. “The price is definitely going up now.”

Professor Chart smiled but didn’t answer. Instead, he projected two nearly identical stock charts onto a giant screen. Both showed the same Double Bottom pattern. Both looked equally convincing.

“Tell me,” the professor asked, “which one will succeed?”

Arjun confidently pointed to both.

“They’ll both break out!”

Professor Chart clicked a button. On the first chart, the stock broke above resistance and continued rising strongly. The class applauded.

Then the second chart came alive. Instead of rising, it briefly moved above resistance before falling sharply below support. Traders who bought the breakout were trapped.

Arjun stared at the screen in disbelief.

“But… both charts looked exactly the same!”

Professor Chart nodded.

“That’s the lesson every trader must learn. Chart patterns don’t predict the future. They simply tell us what is more likely to happen based on history.”

He continued, “Markets are influenced by news, emotions, institutions, global events, and thousands of buyers and sellers making decisions every second. No pattern can control those forces.”

Arjun finally understood that successful traders don’t blindly trust patterns. They combine chart patterns with confirmation, volume, trend analysis, and disciplined risk management. The mission was not about finding certainty—it was about making smarter decisions under uncertainty.

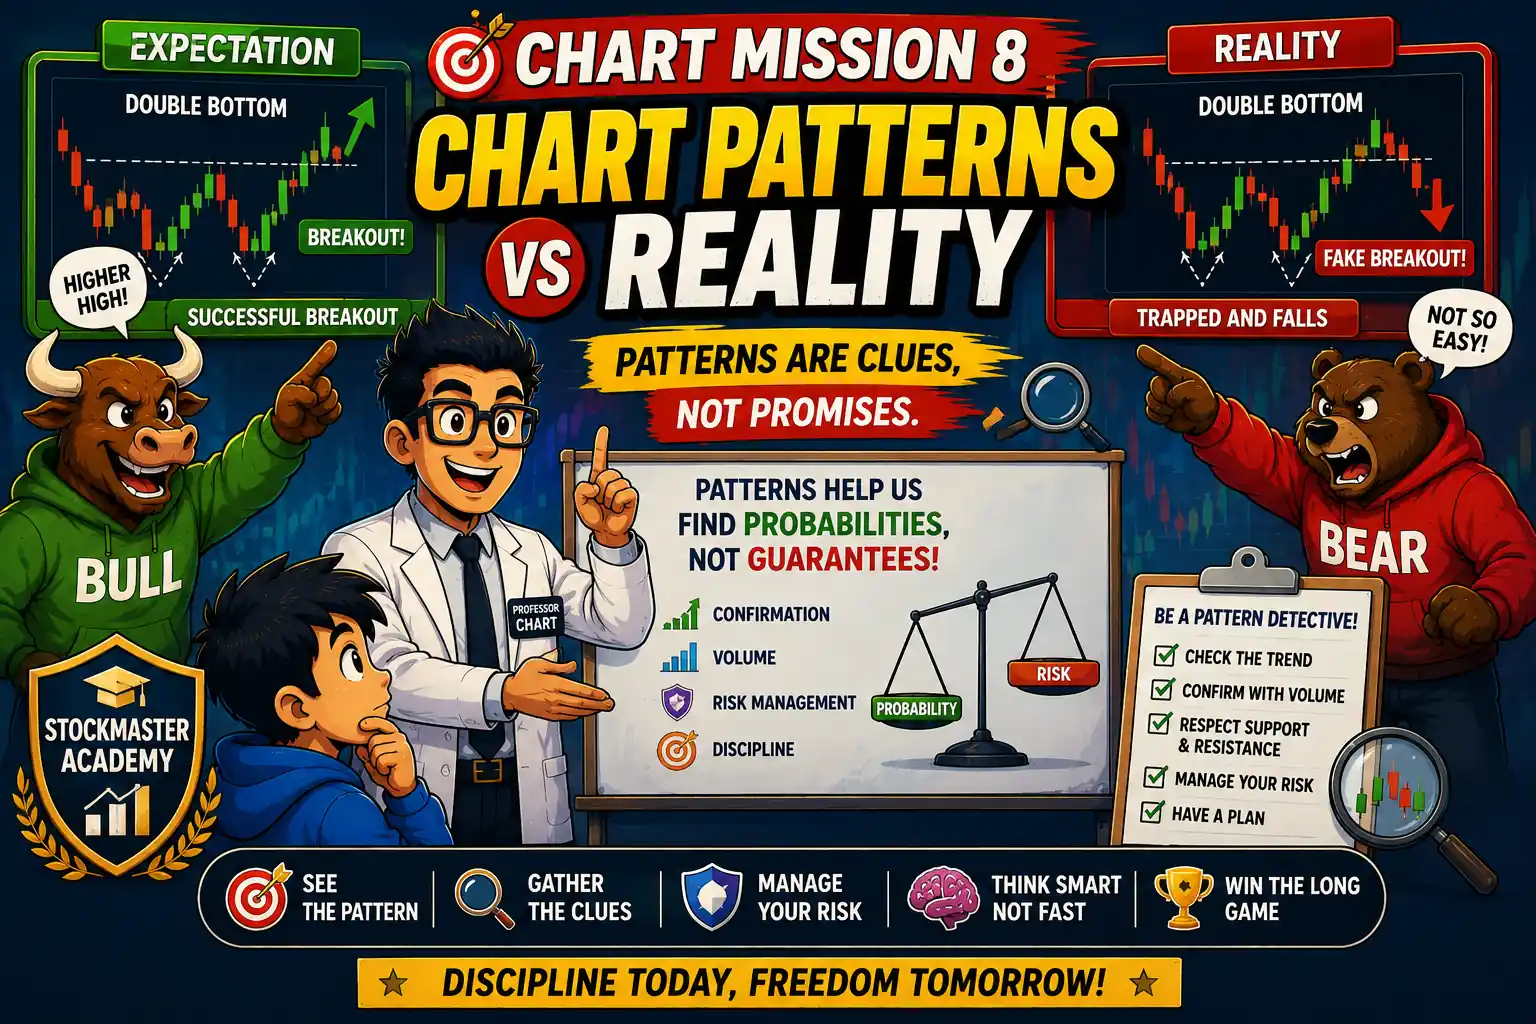
 

Chart Mission 8 comic panels 1 to 5 introducing chart patterns versus reality, Double Bottom pattern, successful breakout, failed breakout, and the lesson that patterns improve probability rather than guarantee profits. Chart Mission 8 comic panels 6 to 10 explaining probability, breakout confirmation, volume confirmation, bull traps, bear traps, and why traders should wait for confirmation before entering a trade. Chart Mission 8 comic panels 11 to 15 teaching confirmation checklists, trading discipline, stop-loss, risk management, and earning the Pattern Detective badge after learning that chart patterns are clues, not promises.

What We Learned

Chart patterns are among the most popular tools in technical analysis because they reflect recurring behavior in financial markets. Since human emotions such as fear, greed, hope, and panic repeat over time, similar price formations often appear on stock charts. Patterns like Head and Shoulders, Double Top, Double Bottom, Triangles, Flags, and Cup and Handle help traders identify situations where prices may continue or reverse.

However, one of the biggest misconceptions among beginners is believing that chart patterns guarantee future price movements. They do not. A pattern only represents a possible scenario based on historical behavior. Every trade still carries uncertainty because markets constantly react to fresh information, changing investor sentiment, economic data, and institutional buying or selling.

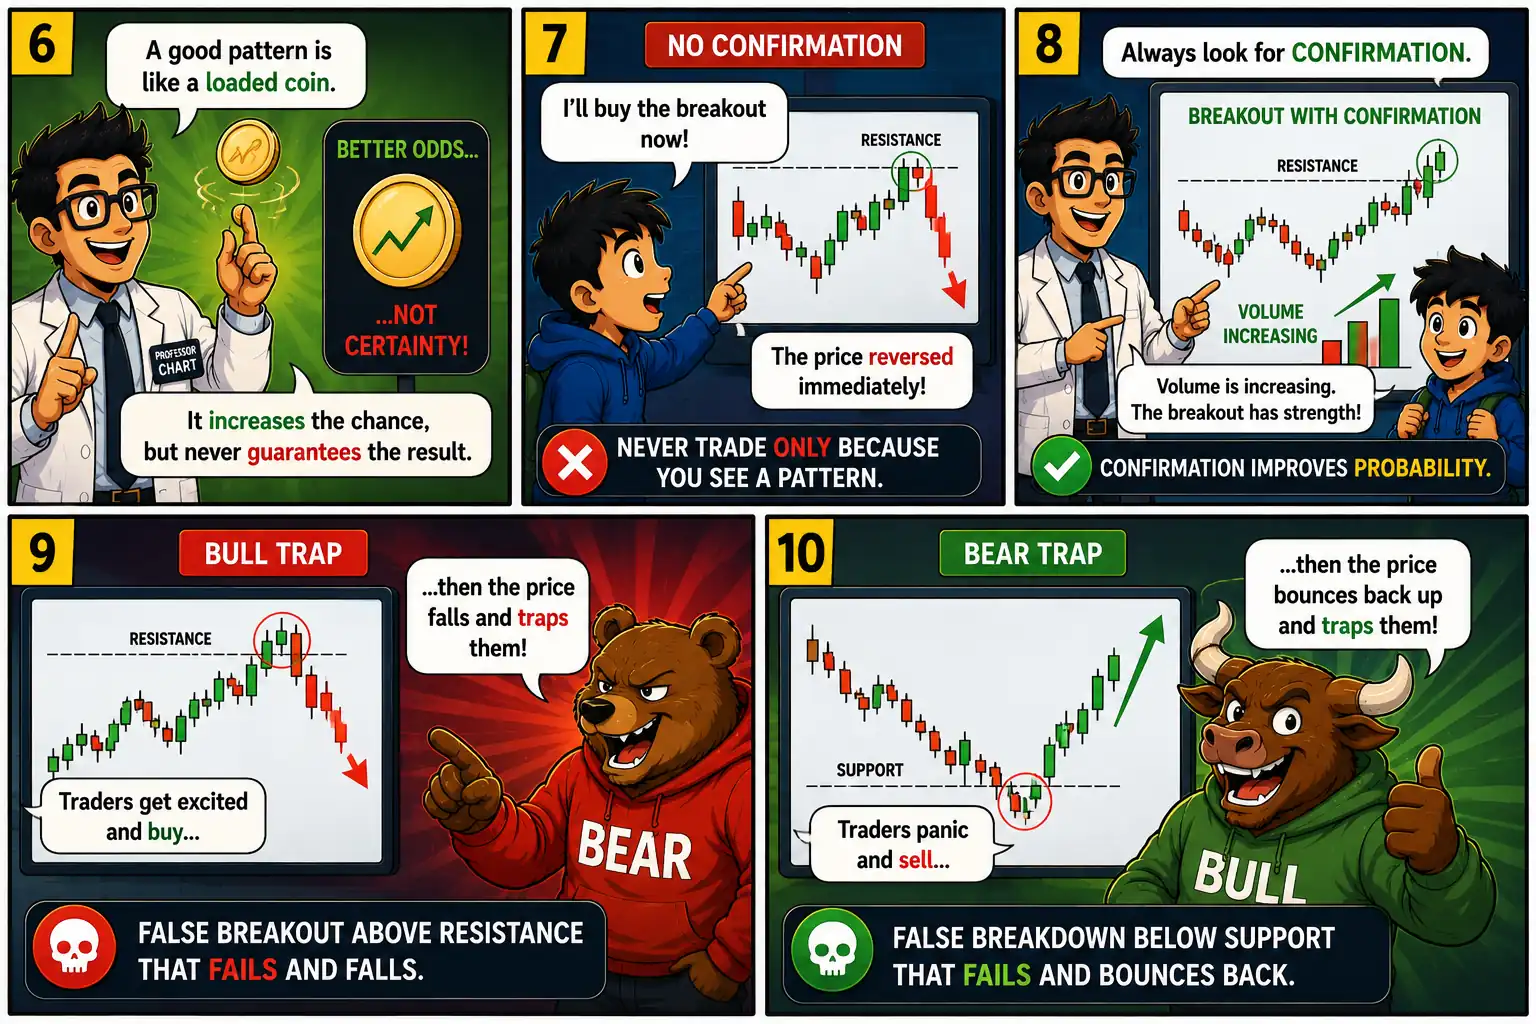
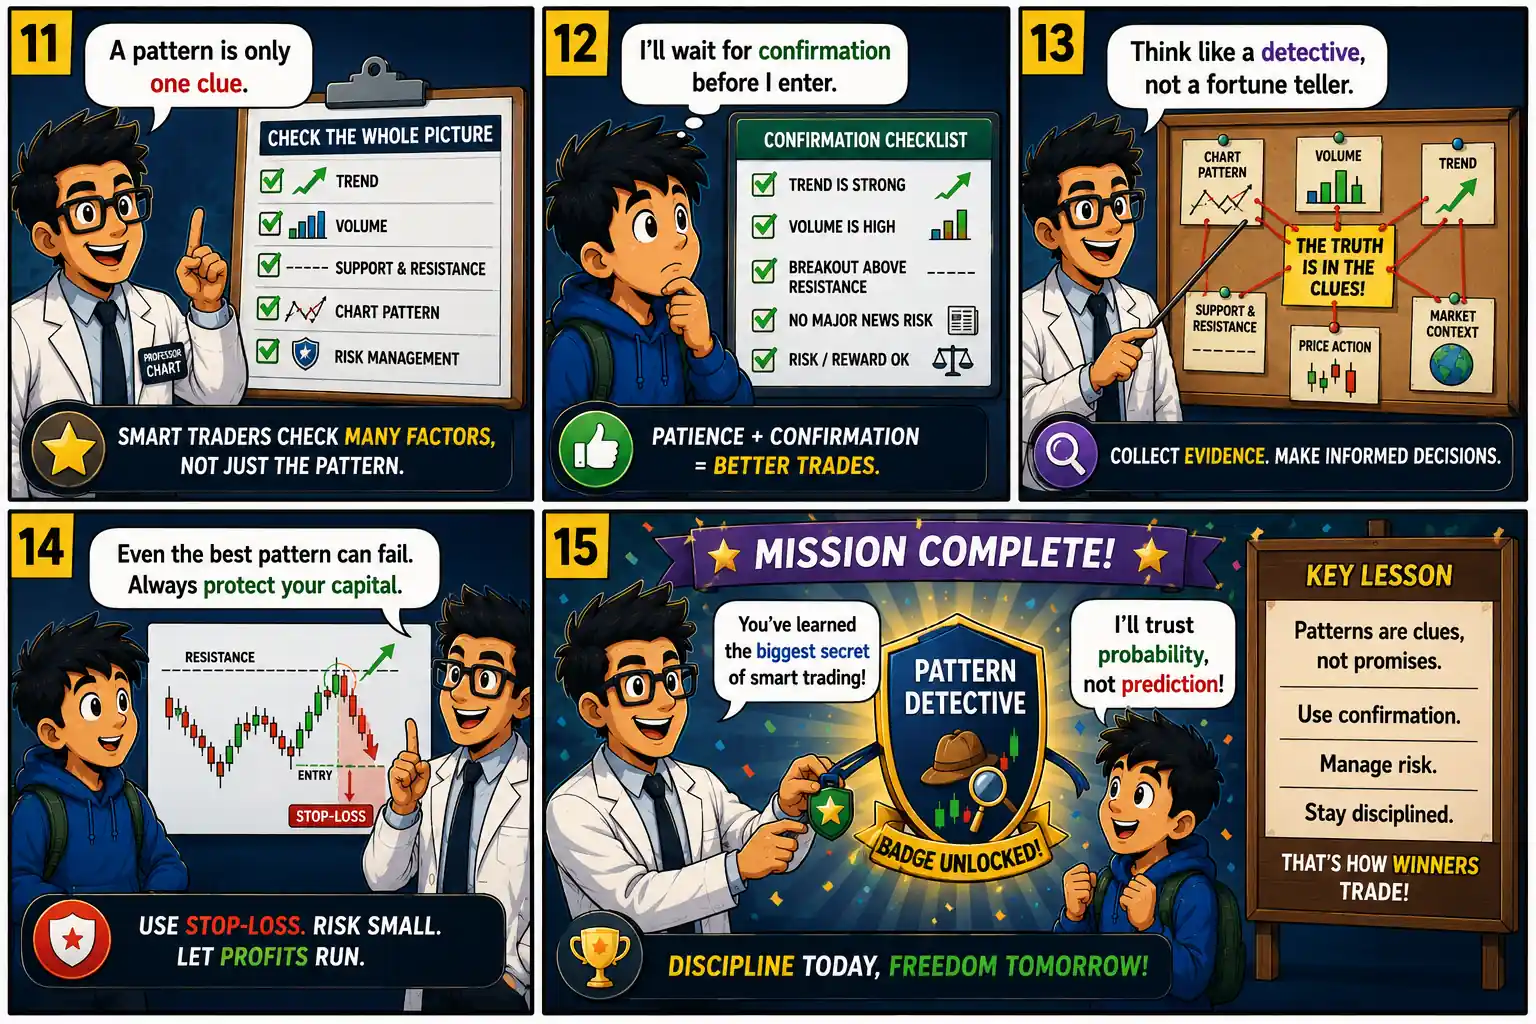
Professional traders understand this difference. Instead of acting immediately after spotting a pattern, they wait for confirmation. They check whether volume increases during a breakout, whether the overall trend supports the trade, and whether important support or resistance levels have been respected. They also evaluate the broader market environment before making a decision.

Risk management is equally important. Even the strongest-looking pattern can fail unexpectedly. That is why experienced traders always use stop-loss orders, define their maximum acceptable loss before entering a trade, and avoid risking too much capital on a single position. Their objective is not to win every trade but to protect capital while allowing profitable trades to grow.

The most successful investors think like detectives rather than fortune tellers. They gather multiple pieces of evidence before making a decision and remain flexible when the market behaves differently than expected.

The greatest lesson from this mission is simple: Chart patterns are valuable clues—not promises. They improve probabilities, but discipline, patience, confirmation, and risk management are what transform technical analysis into a successful trading approach.

Key Takeaways

Key Takeaways

  • 📊 Patterns are guides, not guarantees.
  • 📈 Always wait for confirmation before trading.
  • 📉 False breakouts happen frequently.
  • 📦 Use volume, trend, and support/resistance together.
  • 🛡️ Always use a stop-loss.
  • 🧠 Think like a detective, not a fortune teller.

Vocabulary

Chart Pattern – A recurring price formation on a stock chart.

Breakout – Price moves above resistance or below support.

Bull Trap – A false upward breakout that quickly reverses.

Bear Trap – A false downward breakout that quickly reverses.

Confirmation – Additional evidence supporting a trading decision.

Stop-Loss – A predefined exit level to limit losses.

Smart Investor Tip 

Professional traders don’t ask, “Is this pattern perfect?” They ask, “If this pattern fails, how much can I afford to lose?”

Next Chart Mission Preview

Chart Mission 9 – Why Price Moves

Arjun has learned that chart patterns are only clues—but what actually makes prices rise and fall? In the next mission, Professor Chart reveals the hidden forces behind every market move: buyers and sellers, supply and demand, breaking news, company earnings, institutional investors, and crowd emotions like fear and greed. Through exciting real-world examples and easy-to-understand comics, Arjun discovers why the same news can send one stock soaring while another crashes. Get ready to uncover the real engine that drives every candlestick and learn why understanding why price moves is the foundation of becoming a smarter technical analyst.

Coming Next: Chart Mission 9 – Why Price Moves

Scroll to Top